
Key takeaways
- Two macro events shaped the week: the Federal Reserve's January meeting minutes, released on Wednesday, signaled no imminent rate cuts. On Friday, the December PCE inflation report exceeded expectations, pressuring risky assets.
- Bitcoin entered the week near $67,360, pushed toward $69,200 on Tuesday, then fell to a weekly low of $65,800 after the FOMC minutes. The PCE release added a fresh headwind into the weekly close.
Market commentary
Between February 16th and 20th, the crypto market shifted from post-CPI optimism into a more cautious phase. The defining development late in the week was the latest U.S. PCE inflation release, which came in firmer than expected pressuring risk assets.
As inflation data crossed the wires on Friday, Bitcoin began losing ground, reflecting renewed uncertainty around rate expectations.
This week’s story was not about a dramatic breakdown or breakout. It was about rejection at resistance, liquidity sweeps, and macro sensitivity returning to the surface. However, going to next week this might change as the Supreme court on Friday ruled against Donald Trump’s global tariffs.
Bitcoin (BTC): What happened this week?
Looking at the charts from TabTrader this week, the structure was clear from the first candle. Bitcoin opened Monday already below the prior week's Sunday high of $70,900. This reflected the faded weekend bounce. Price made a quiet push toward $69,200 on Tuesday. The FOMC minutes hit on Wednesday, triggering the week's sharpest move.
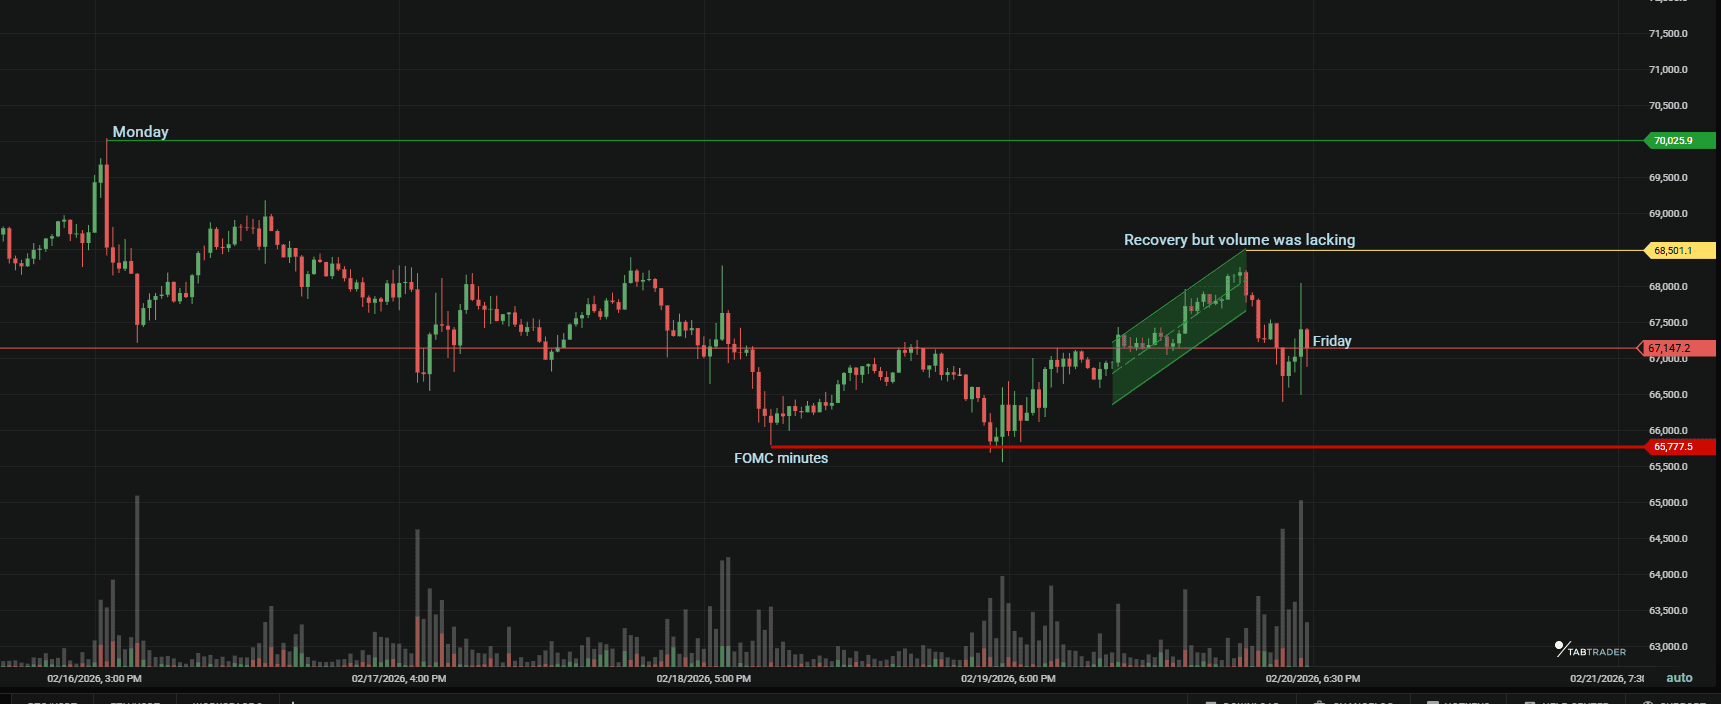
BTC weekly price movement.
The recovery from $65,800 back toward $67,000 on Thursday was orderly but lacked volume. Then, Friday's PCE data came in above expectations. This removed whatever tentative confidence had been rebuilt.
Key levels held
- Resistance around $70,000 remains intact.
- Support at $66,000–$65,500 holds for now
The broader range structure remains intact. Until price accepts above resistance or breaks below support, Bitcoin remains rotational.
One clear technical narrative
The charts this week capture a market absorbing hotter inflation data and persistent outflows, while holding core structure. Bitcoin defended key levels but lost ground on the PCE release. This underscores the ongoing tug-of-war between macro caution and technical resilience.
The single narrative: price continues to respect the $65,600–$66,000 demand zone as a structural floor while failing to generate conviction above $70,000 resistance.
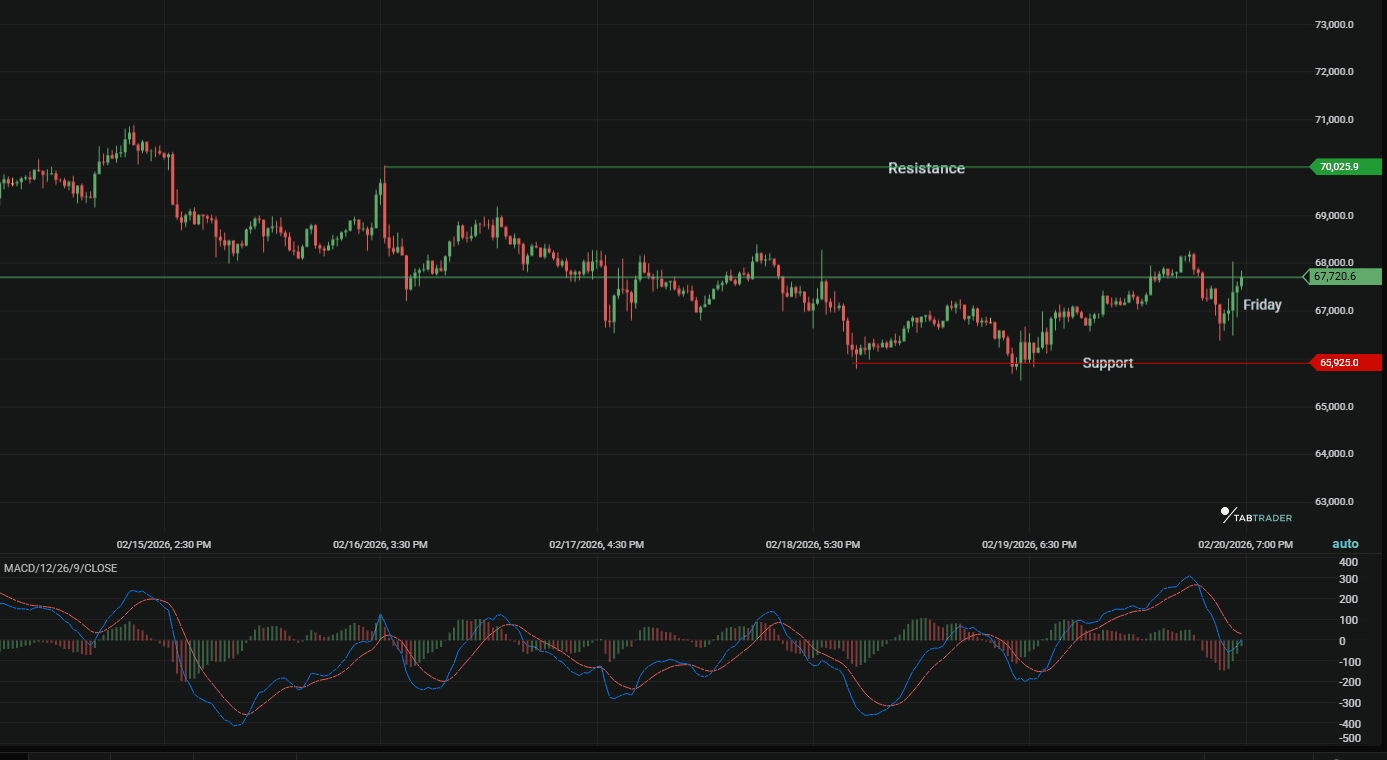
BTC support and resistance.
Even after the PCE reaction, the structure remains intact. The price is approximately 14.5 percent below its February 2026 high, but no weekly support has been decisively broken.
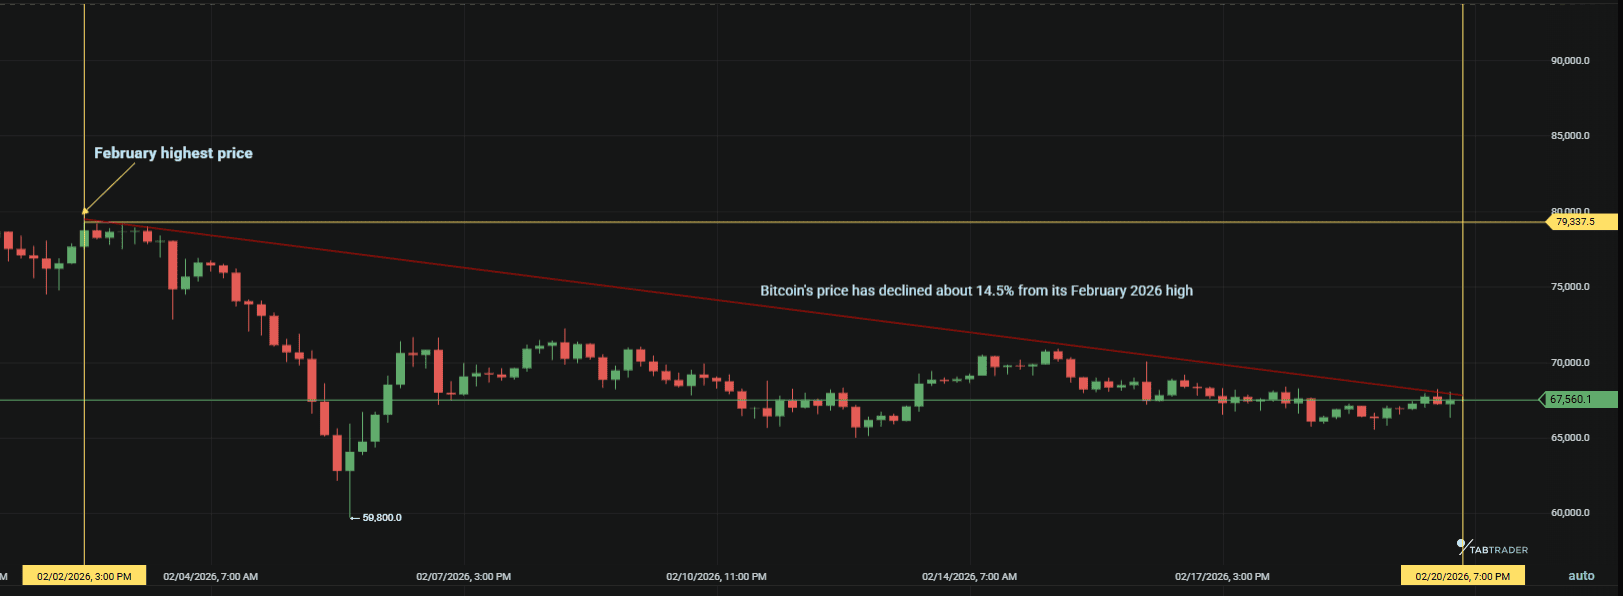
BTC decline February.
FAQs
Why has $70,000 remained such stubborn resistance?
It represents a round psychological level, the upper boundary of the current symmetrical triangle on the weekly chart, and the 50-day moving average. Multiple failed closes above it since early February have reinforced seller control at that zone.
Why did Bitcoin fall after the PCE inflation report?
Bitcoin weakened after U.S. PCE inflation came in hotter than expected. This reduced confidence in near-term rate cuts. Higher inflation increases the likelihood of prolonged restrictive Federal Reserve policy, which often pressures risk assets.
What should traders watch next week?
Watch resistance at $70,500- $71,000 and support at $65,500- $66,000. Decisive moves beyond these levels could signal range expansion.
How did altcoins perform relative to Bitcoin?
Most major altcoins showed beta to BTC, trading in similar consolidations. ETH fell 2.5% to 3%, and SOL tested its own demand zones. No meaningful outperformance or decoupling occurred. This reinforced Bitcoin’s dominance in setting the market tone.
What was the biggest price mover of the week?
The December 2025 PCE print on February 20 acted as the clearest catalyst. Both headline and core readings were hotter than forecast, alongside the weak GDP figure. Risk assets faced fresh headwinds and a stronger dollar reaction. This combination kept the market in a defensive, range-bound posture all week.
Bottom line
Two macro headlines in one week were enough to test market confidence. Resistance near $70,000 continues to cap upside, while demand near $66,000 remains steady. Inflation data reminded traders that rate-cut expectations can shift quickly. Crypto remains sensitive to that reality.
For now, the range holds. The coming week will show whether Bitcoin can regain momentum above resistance or whether macro pressure pushes price back toward deeper support.
Ready to trade the volatility?
Connect to over 20 exchanges from a single dashboard including Binance, Kraken now available at 50% off.

Important Note: TabTrader does not provide investment, tax, or legal advice, and you are solely responsible for determining whether any financial transaction strategy or related transaction is appropriate for you based on your personal investment objectives, economic circumstances, and risk tolerance. Tab Trader may provide information that includes but is not limited to blog posts, articles, podcasts, tutorials, and videos. The information contained therein does not constitute investment advice, financial advice, trading advice, or any other sort of advice, and you should not treat any of the content as such. TabTrader does not recommend that any digital asset should be bought, earned, sold, lent out, or held by you, and will not be held responsible for the decisions you make.