Crypto Chart of the Week: CPI Relief Sparks a Bounce, but Is a Breakout Coming?
Key-takeaways
- January 2026 U.S. CPI printed at 2.4% YoY, below the 2.5% forecast, with prices rising 0.2% MoM, easing macro pressure on risk assets. The softer inflation data triggered a broad relief rally, with Bitcoin climbing around 4% intraday.
- Despite the relief bounce, fear and low conviction remain. The Fear and Greed Index sits at 8. Bitcoin and Ethereum stay in consolidative ranges, not breakout structures.
Market commentary
The week saw range-bound action after earlier volatility. Bitcoin traded between $65,000 and $68,000, with no strong breakout. Cooling U.S. inflation to 2.4% provided macro relief for risk assets. Yet price action shows little conviction.
On-chain behavior supports this pause. Bitcoin whales reduced exchange balances, a pattern tied to accumulation phases. However, without clear volume expansion, this is just a setup, not a signal.
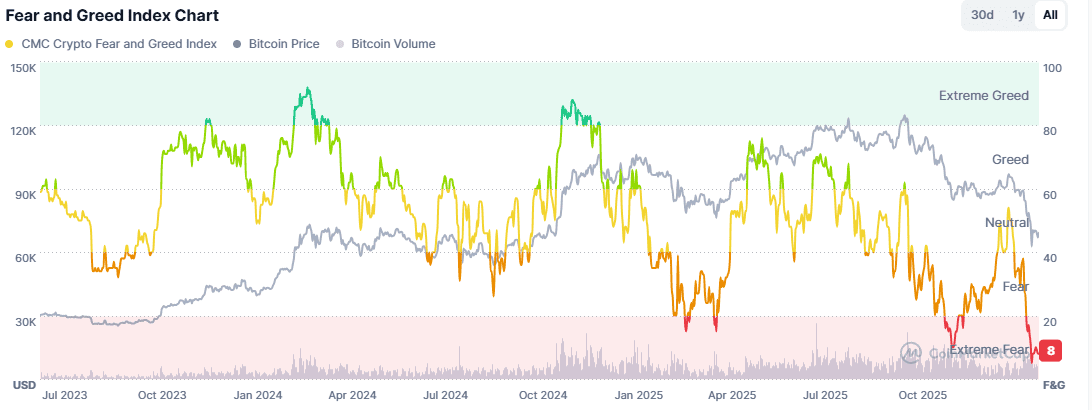
Courtesy of CMC.
Bitcoin (BTC) Technical Analysis
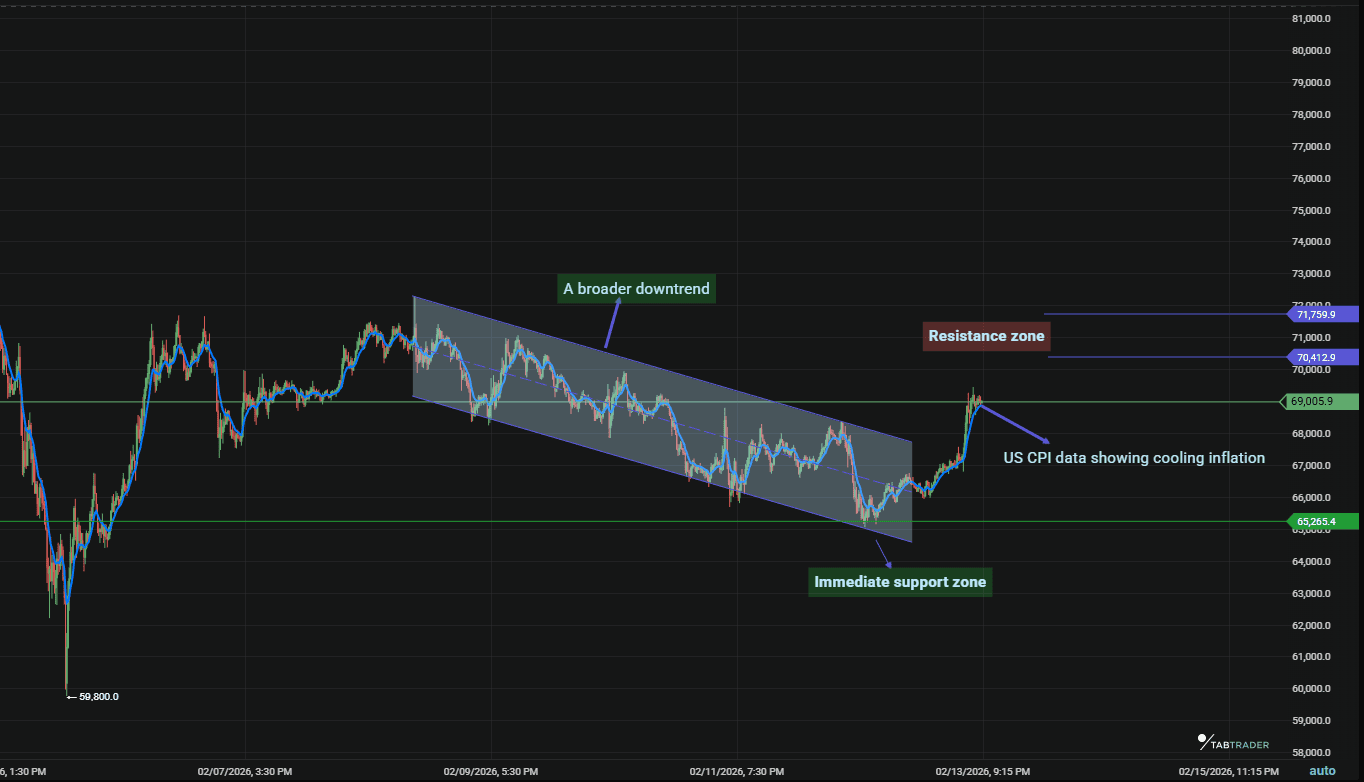
Bitcoin remains in a tight sideways consolidation within its broader corrective downtrend. On the four-hour chart, BTC forms higher lows near $65,000. It has repeatedly tested resistance between $68,000 and $69,000 with no clear breakout.
BTC/USDT
Key Levels:
- Support: $65,000 (immediate), $59,900-$60,000 (major). Resistance: $69,000-$70,000
- Volume: Moderate and declining on advances; no impulsive surges on four-hour, indicating a corrective rather than trending move.
- RSI: Around 31 on four-hour (neutral/oversold edge, potential for relief if divergence builds).
- Candles and closes: Long lower wicks near support show buying defense, while rejections around resistance keep BTC contained within its range.
Ethereum (ETH) Technical Analysis
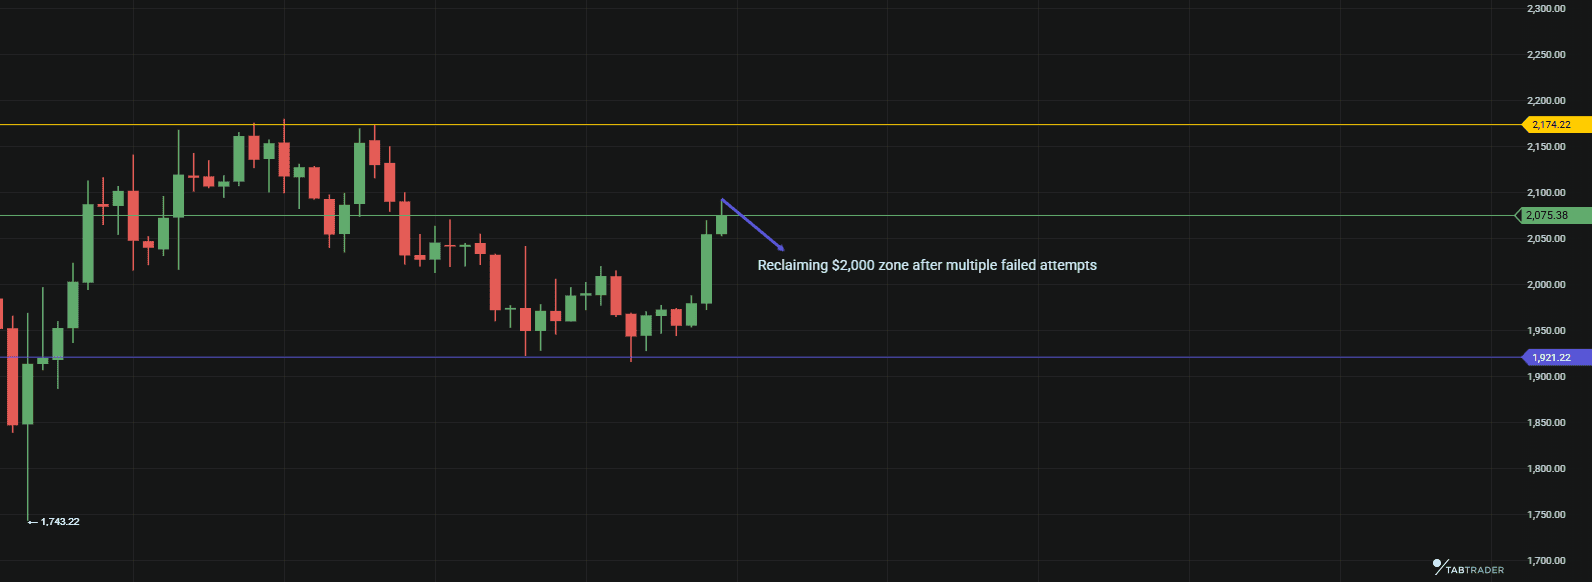
Ethereum’s four-hour chart shows consolidation with a slight downside bias. Price has reclaimed the $2,000 level after several failed attempts earlier in the week.
The $1,900–$2,000 zone remains a key demand area, now serving as short-term support. ETH has yet to decisively reclaim $2,100. Holding above $2,000 improves near-term structure. Further upside is possible if volume expands.
ETH/USDT
- Trend and Structure: Downward bias with consolidation. The four-hour chart shows tests of the lower range but no reclaim of prior highs. ETH lags BTC and holds structure near the $1,900-$2,000 zone.
- Key Levels: Support: $1,900-$1,926 (defended), $1,800 (deeper). Resistance: $2,030-$2,100 (near-term), $2,150+.
- Volume: Steady but not elevated; fades on upside attempts.
- RSI: Near 35-40 on four-hour (climbed from oversold, mild bullish divergence possible on lows).
- Candles and Closes: Multiple lower wicks appear at support. Closes landed near $1,940-$2,019 by week’s end, after dips to $1,897-$1,925.
What should traders watch next?
As we head into the Valentine ‘s Day weekend, focus on:
- BTC: breakout above $69,000 or breakdown below $65,000.
- ETH: reclaiming and holding above $2,100.
For both, volume expansion on breakouts is key.
FAQ
1. What drove the range-bound price action?
A lack of follow-through volume and persistent macro uncertainty have kept BTC trading tight between $65K and $69K, even as softer inflation data temporarily lifted prices.
2. Is the inflation data bullish for crypto?
Yes. A cooler-than-expected CPI suggests macro pressure is easing, which can support crypto prices if Fed expectations shift toward a dovish policy.
3. What are the key levels to monitor next week for BTC and ETH?
- BTC: $65,000 support, resistance:$69,000
- ETH: $1,900 support, resistance:$2,100
Ready to trade the volatility?
Connect to over 20 exchanges from a single dashboard including Binance, Kraken now available at 50% off.
Important Note: TabTrader does not provide investment, tax, or legal advice, and you are solely responsible for determining whether any financial transaction strategy or related transaction is appropriate for you based on your personal investment objectives, economic circumstances, and risk tolerance. Tab Trader may provide information that includes but is not limited to blog posts, articles, podcasts, tutorials, and videos. The information contained therein does not constitute investment advice, financial advice, trading advice, or any other sort of advice, and you should not treat any of the content as such. TabTrader does not recommend that any digital asset should be bought, earned, sold, lent out, or held by you, and will not be held responsible for the decisions you make.