Crypto Chart of the Week: Risk-off sentiment Triggers Price Correction (Jan 26–31, 2026)

Key takeaway:
- Crypto markets endured a brutal 6-8% sell-off over the five days. However, oversold RSI levels across majors hint at exhaustion selling, potentially setting up a rebound if regulatory wins such as the Senate's market structure bill materialize.
Commentary:
The macro-driver: Shutdown risks and liquidation cascade
The week was dominated by macro headwinds, including speculation around a hawkish Fed chair pick Kevin Warsh and benchmark rates stuck at 3.5%-3.75% with no cuts signaled. A potential U.S. government shutdown by Jan 31 amplified risk-off moves, historically triggering 20%+ Bitcoin dumps.
This converged with $1.7B in liquidations, including $780M in longs wiped out in just 30 minutes on Jan 30, as leverage unwound across derivatives. Institutional caution showed in $1.1B+ Bitcoin ETF outflows for the week ending Jan 26.
What’s the implication for crypto?
The sell-off washed out leverage, but positive developments, like Trump administration official David Sacks declaring the U.S. one step closer to becoming the "crypto capital of the world" amid Senate progress on regulations, could fuel a recovery. Analysts warn of further downside if macro deterioration, but the setup favors a modest rebound if stability emerges.
Bitcoin chart of the week: Bracing for lower support?
Bitcoin's plunge from a Jan 26 high near $88,972 to $82,300 with the flush accelerating on Jan 29-30 amid the liquidation wave. This effectively eroded January's gains as traders brace for further downside in prices.
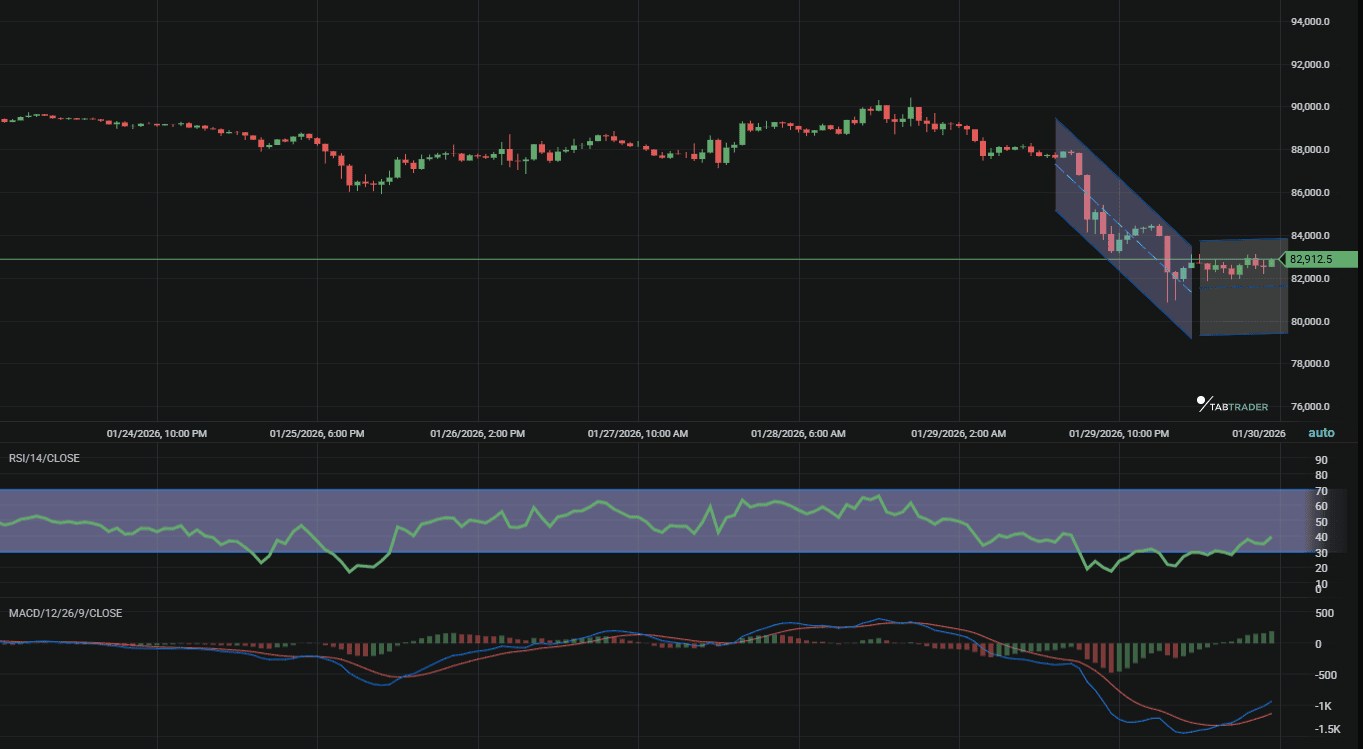
Bitcoin price movement.
- Trend & market structure: Short-term bearish, locked in a descending channel; the longer-term uptrend remains viable if volume supports around $70,000-$80,000 hold firm, as highlighted by volume profile clusters.
- Major support & resistance: Immediate support in the $81,000-$85,000 range resistance overhead at $88,000, flipping from support.
- Volume behavior: Surged on the downside moves, peaking with the $1.7 billion liquidation event, indicative of capitulation; quieter volume on minor upticks suggests buyers are sidelined for now.
- RSI: 14-period daily RSI dipped to below 30, entering oversold territory that often precedes exhaustion and short-term bounces. Currently above 40, indicating short-term relief buying rather than a full trend reversal.
- Candle structure & closes: Early-week hammers on Jan 26-27 showed initial rejection of lows, but gave way to aggressive bearish engulfing patterns on Jan 29-30, with wide-bodied down closes confirming seller control.
Ethereum (ETH) Ethereum
Ethereum underperformed slightly relative to Bitcoin, with the ETH/BTC ratio continuing its slide drawing near to November lows as ETF outflows remained sustained, recording $155 million of net outflows on Jan 29th, reflecting broader caution on altcoins.
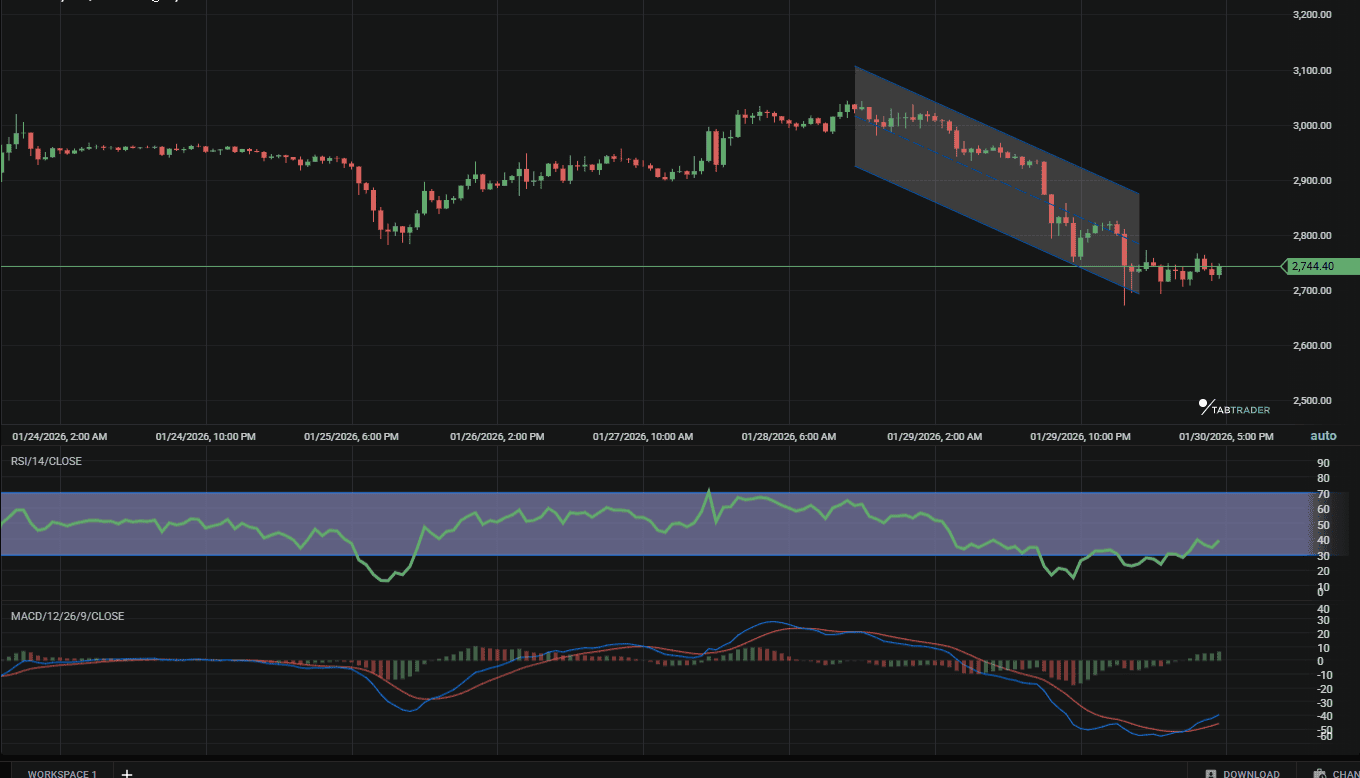
Ethereum price movement.
- Trend & market structure: In a clear short-term downtrend with failed higher lows; the structure holds constructive above yearly supports, but needs a macro catalyst to reverse.
- Major support & resistance: Support clustering at $2,500-$2,700; resistance at the $3,000 pivot, aligning with the 50-day MA (~$3,100).
- Volume behavior: Spiked during the plunges, particularly on Jan 29, before tapering on Jan 30, a potential sign of seller fatigue.
- RSI: Hovering around 25 on the daily, oversold and poised for divergence if buying pressure returns. If RSI fails to hold the 40 zone and rolls over, it would indicate that sellers are regaining control and downside pressure could resume.
- Candle structure & closes: Bullish wicks early in the week transitioned to dominant down closes by Jan 29-30, underscoring the shift in momentum.
Solana (SOL)
Solana tracked the majors lower, even as its ETFs crossed $1 billion in assets, a testament to the broad risk-off environment hitting higher-beta plays hardest.
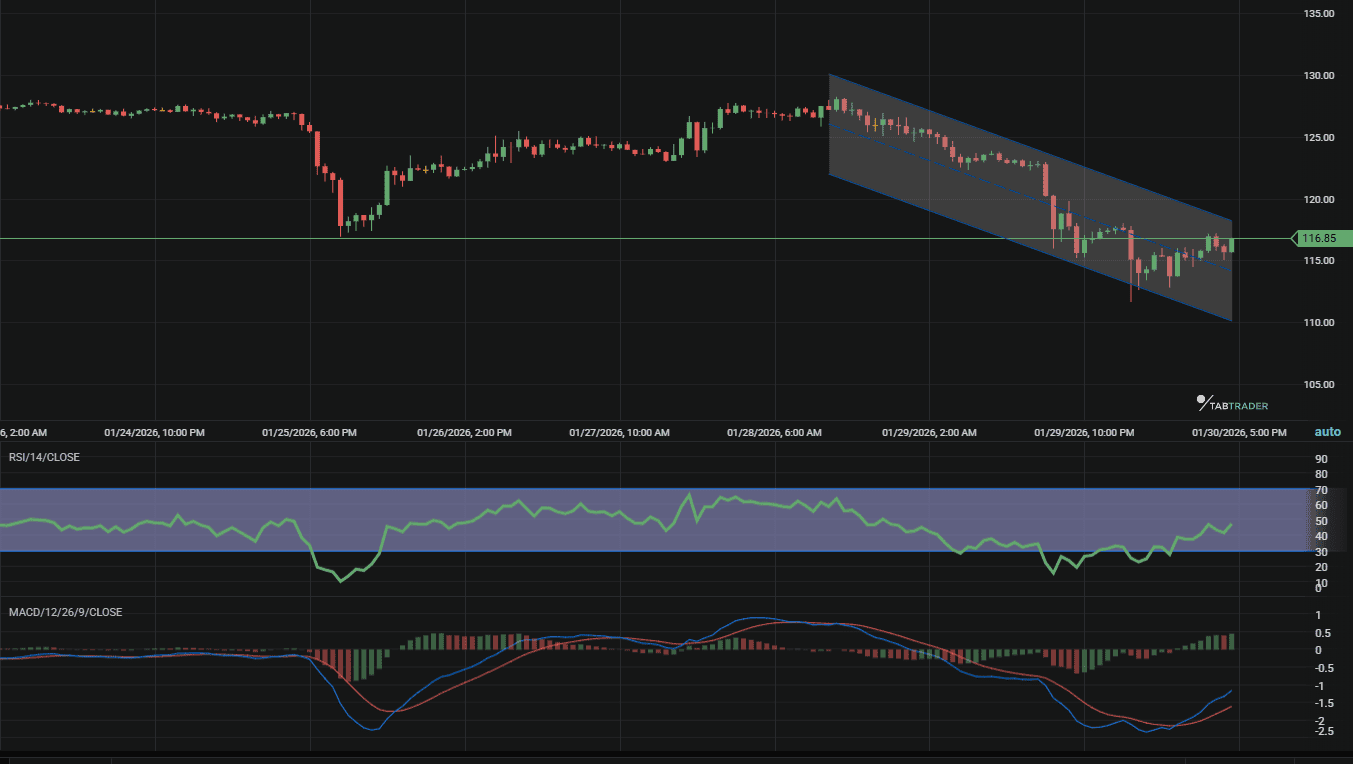
Solana price action.
- Trend & market structure: Short-term bearish breakdown from range-bound action; the uptrend persists if $110 holds as a floor.
- Major support & resistance: Key support at $110-$112; resistance in the $120-$125 zone, now acting as a ceiling.
- RSI: Daily 14-period at ~23, deeply oversold and hinting at buyer opportunity on reversal cues.
- Candle structure & closes: Initial upside attempts via wicks on Jan 26-27 reversed into strong marubozu-style down candles by Jan 29-30.
Bottom line: volatility ahead
Until key resistance levels are reclaimed, volatility remains elevated. This was likely a leverage-driven reset, not a trend reversal, but confirmation will matter more than speed. Patience beats prediction in this environment.
Connect to over 20 exchanges from a single dashboard including Binance, Kraken, and now Bybit.
Important Note: TabTrader does not provide investment, tax, or legal advice, and you are solely responsible for determining whether any financial transaction strategy or related transaction is appropriate for you based on your personal investment objectives, economic circumstances, and risk tolerance. Tab Trader may provide information that includes but is not limited to blog posts, articles, podcasts, tutorials, and videos. The information contained therein does not constitute investment advice, financial advice, trading advice, or any other sort of advice, and you should not treat any of the content as such. TabTrader does not recommend that any digital asset should be bought, earned, sold, lent out, or held by you, and will not be held responsible for the decisions you make.