Bitcoin Technical Outlook:Will BTC Break $116K or Slip toward $110K? (October 28, 2025)

Updated October 28.
Key takeaways:
- Bitcoin holds firm near $115,500 after rebounding from $106,500, but faces stiff resistance ahead of a record $31 billion options expiry on Friday.
- Technical momentum remains bullish, with Bitcoin trading above all major moving averages. However, overbought RSI levels signal a potential short-term cooldown.
- Macro events could sway the trend, with the Fed’s expected rate cut and the Trump–Xi trade meeting both set to shape sentiment across risk assets this week.
Bitcoin starts the new week perched at a precarious crossroads, trading around $115,500 after staging a solid recovery from last week’s dip to $106,500. That bounce wasn’t just technical noise. It’s pushed the price right back into a major resistance zone, and what happens here over the next few days could shape the short-term trend.
Market sentiment has thawed noticeably. The CMC, Crypto Fear and Greed Index has climbed from “Extreme fear” to a neutral 51, suggesting traders are finally exhaling a bit after last week’s nerves.
Key technical levels
Bitcoin is locked in a tight range between $110,000 and $115,500. A range that’s likely to define the week ahead.
- Immediate resistance – $115,500: The current ceiling. A daily close above this line would be a strong signal that the bulls are back in charge, potentially unlocking a fresh wave of momentum.
- Next resistance zone – $120,000 to $123,000: If Bitcoin clears $115,500, the next stop is likely near the $120,000 mark, not just a psychological barrier but also where a mountain of call options sits for Friday’s expiry. Beyond that, $123,000 and the year-to-date high of around $126,200 come into play.
- Immediate support – $111,800 to $112,000: This is the short-term line in the sand, aligning neatly with the 20-day moving average. As long as Bitcoin stays above it, the bullish tone holds.
- Secondary support – $110,000: Once resistance, now support. A clean break below here would be the first sign that momentum’s slipping.
- Major support – $106,500 and $100,000: $106,500 marks the launchpad of the current rally. Below that sits the big round number, $100,000, a psychological fortress and a zone loaded with put option open interest, which could slow any deeper selloff.
Key technical indicator analysis
A quick scan of the main technical gauges shows that Bitcoin’s still running hot, bullish momentum remains dominant, though some short-term caution lights are starting to blink.
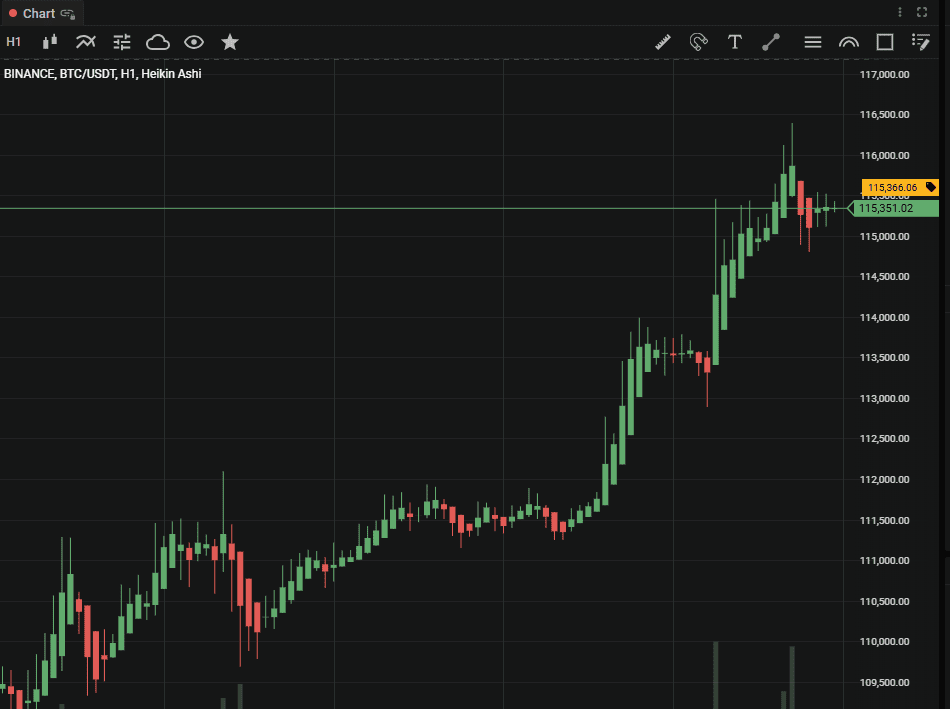
<i>Bitcoin holds firm near $115,500 after rebounding from $106,500</i>
The 14-day RSI on the daily chart just crossed 72, which firmly places it in overbought territory. Zoom in on the hourly chart, and it’s even more stretched, sitting above 81. That tells us the recent rally has real strength and speed behind it, but it’s also getting a little ahead of itself. A short breather, maybe a mild pullback to retest new support, wouldn’t be unusual here.
Meanwhile, the MACD continues to back the bulls. The daily MACD line is trending comfortably above its signal line, which is classic confirmation that upward momentum hasn’t lost its grip yet. Add to that the fact that Bitcoin’s price is trading well above its 50-, 100-, and 200-day moving averages, all sloping nicely upward, and you’ve got the picture of a strong, healthy long-term uptrend, even if the short-term chart’s due for a quick cooldown.
Macroeconomic context
The next seven days aren’t just about charts. A very busy macro calendar shapes them.
Front and center is the Federal Reserve’s FOMC meeting on Wednesday, October 29. Markets are almost entirely pricing in a 25 basis point rate cut, from 4.00–4.25% down to 3.75–4.00%. Such a move typically gives a boost to riskier assets, like Bitcoin. Lower rates make cash less attractive, and traders start hunting for yield and growth elsewhere.
The rate cut expectations come on the back of a cooling labor market, even though inflation is still running above the Fed’s 2% target. And to make things trickier, the ongoing U.S. government shutdown has frozen the release of key economic data, meaning the Fed’s decision this week will be made with more guesswork than usual.
As if that weren’t enough, there’s also a high-stakes meeting on Thursday, October 30, between President Trump and President Xi, where a trade deal is reportedly on the table. Markets are already leaning heavily into a “risk-on” mood because of it, and that optimism has been feeding directly into Bitcoin’s momentum.
Possible scenarios for the week ahead
This week revolves around one monster event: a record-breaking $31 billion in Bitcoin options expiring on Friday, October 31, roughly split between Deribit ($14B) and CME ($13.5B). This expiry is likely to steer the entire week’s price action.
Here’s how it might unfold:
1. Early-week compression, then expansion
Before big expiries, prices tend to get “pinned” near the max pain zone. The level at which most options expire worthless. With huge open interest around $100K (puts) and $120K (calls), that pin might sit somewhere between $105K and $110K. In other words, don’t be shocked if prices drift or dip slightly early in the week.
2. Key levels as magnets
If Bitcoin slips below $112K, it could quickly slide to $110K as traders adjust their hedges. These levels will act like price magnets leading up to expiry.
3. Post-expiry volatility
Once the options roll off, the pressure releases, and things often move fast. Given the overall bullish structure, positive funding rates, and recent short liquidations, the odds still favor an upside breakout after the dust settles.
Bottom line: a week of cautious Optimism
The setup for the next seven days: cautious optimism with a side of volatility. The long-term structure remains firmly bullish, but the short term is tied to that massive options expiry. Expect some choppy action or a short pullback early in the week, then a potentially sharp directional move into the weekend.
If Bitcoin manages to hold the $111,800–$112,000 support zone through Friday, the door opens wide for a push toward $120K–$123K. Lose $110K, though, and a retest of $106,500 comes back on the table.
Want to learn more about technical analysis? Start here:
Important Note: TabTrader does not provide investment, tax, or legal advice, and you are solely responsible for determining whether any financial transaction strategy or related transaction is appropriate for you based on your personal investment objectives, economic circumstances, and risk tolerance. Tab Trader may provide information that includes but is not limited to blog posts, articles, podcasts, tutorials, and videos. The information contained therein does not constitute investment advice, financial advice, trading advice, or any other sort of advice, and you should not treat any of the content as such. TabTrader does not recommend that any digital asset should be bought, earned, sold, lent out, or held by you, and will not be held responsible for the decisions you make.
مقالات قد تعجبك أيضًا
عرض جميع المقالات وقت القراءة هو 3 دقيقة
TabTrader October Sweepstake: How to Join, Win, and Make the Most of It
The TabTrader October Sweepstake Plan is here! Get a chance to win 1,000 USDT or a free ULTRA subscription. Click here to see the eligibility requirements.
 TabTrader Teamتاريخ النشر هو
- وقت القراءة هو 2 دقيقة
TabTrader October 2025 Sweepstakes: Official Rules
Read the official TabTrader Sweepstakes terms and conditions to learn more about eligibility, entry rules, prizes, and winner selection.
TabTrader Teamتاريخ النشر هو  وقت القراءة هو 5 دقيقة
Breaking Down the New TabTrader Pricing: What’s Changed and Why It Matters
Unlock More Trading Power with Our New, Lower-Priced Pro Subscriptions. Existing PRO users get 1 month FREE upgrade!.
TabTrader Teamتاريخ النشر هو