Exponential Moving Average (EMA) Explained
The exponential moving average is designed to improve on the concept of the simple moving average (SMA) and provide a more accurate assessment of an asset’s recent price moves. Read on to discover how the EMA works and how to use it to identify trends.
What Is EMA?
The exponential moving average (EMA) is a technical indicator and a type of weighted moving average. Similar to other moving averages, the EMA plots the average price of a financial asset over a specified period of time. However, in contrast with the simple moving average (SMA), which assigns equal weight to all the price points in the period, the exponential moving average places greater importance on the most recent data points.
Both the EMA and the SMA are trend indicators. However, as the EMA is more responsive to recent changes, it can catch trends earlier compared to the SMA.
In this article, we discuss the top 11 technical indicators in cryptocurrency trading, including the exponential moving average (EMA) and the simple moving average (SMA). And if you want to find out which technical indicators are most popular with TabTrader users, read our blog article.
How Is the EMA Calculated?
Here is how to calculate the exponential moving average (EMA)
EMA = (Price - EMA_previous) * K + EMA_previous,
where:
- K = 2/(n+1) is the exponential smoothing constant.
n is the number of selected time periods; - Price is the asset’s current price;
- EMA_previous is the value of the EMA for the previous time period.
The first calculation uses the simple moving average (SMA) in place of the EMA for the previous time period (EMA_previous).
How to Use the EMA in Trading?
Here are the most common applications of the EMA in trading.
Trend trading
The EMA is often used to identify trends and determine entry and exit points for trades. The price crossing below the exponential moving average signifies a possible beginning of a downtrend, while the price crossing above the exponential moving average designates a potential start of an uptrend.
However, it is important to note that relying only on the EMA buy and sell signals is not a sound trading strategy. As with any other technical indicator, EMAs are most effective when used in conjunction with other technical indicators and/or candlestick patterns. Read our guide on the most common candlestick chart patterns here.
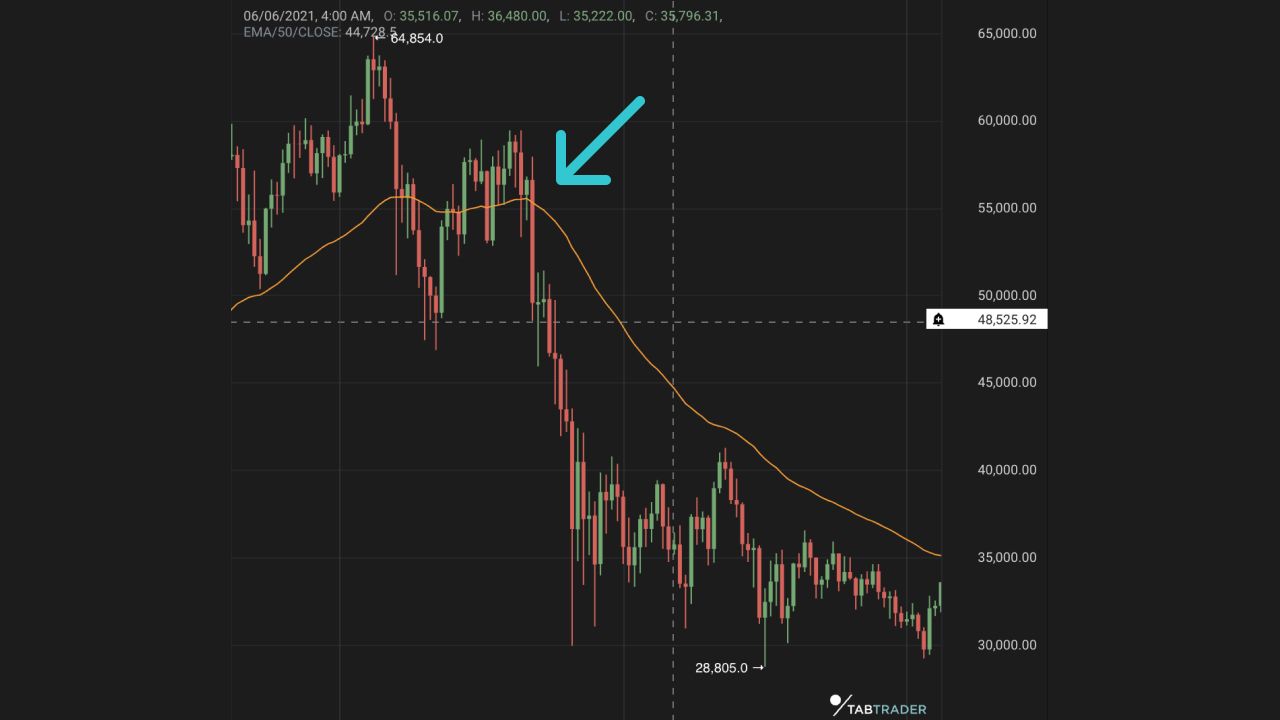
Source: TabTrader App
In the chart above, the price crossing below the 50-day exponential moving average (yellow) signals the beginning of a downtrend.
Dynamic support and resistance levels
The EMA and other types of moving averages also function as dynamic support and resistance levels. A support level occurs in a downtrend whenever a price decline is stopped by a concentration of demand, while a resistance level occurs in an uptrend when price growth pauses due to a concentration of selling interest. In an uptrend, the longer-term exponential moving average (e.g., a 50-day, 100-day, or 200-day moving average) may act as a support line, and in a downward trend, it can function as resistance.
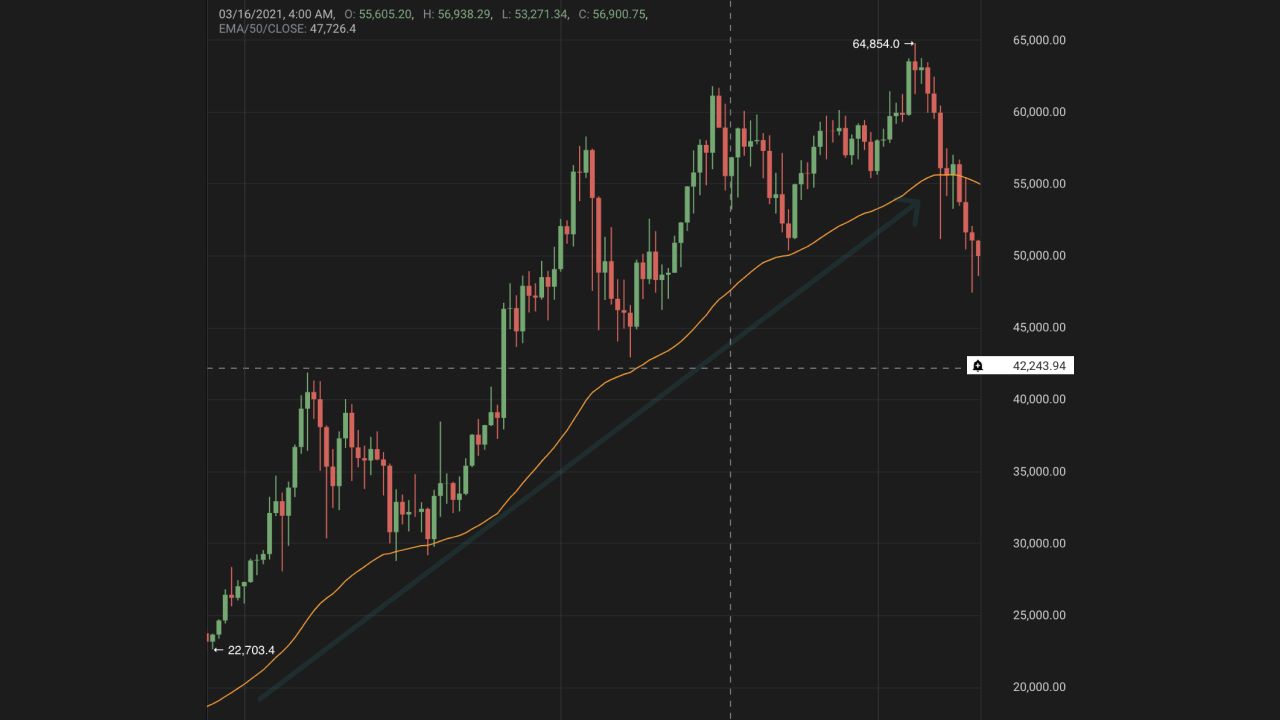
Source: TabTrader App
In this example, the 50-day exponential moving average (yellow) serves as dynamic support to price action.
EMA crossovers
Traders also often use EMA crossovers to generate trading signals. The short-term exponential moving average crossing the long-term exponential moving average to an upside is considered a bullish signal, while the opposite is usually seen as a bearish sign. These crossovers are also at times called “golden cross” and “death cross”, respectively. Check out this article to learn all about the golden cross and death cross chart patterns.
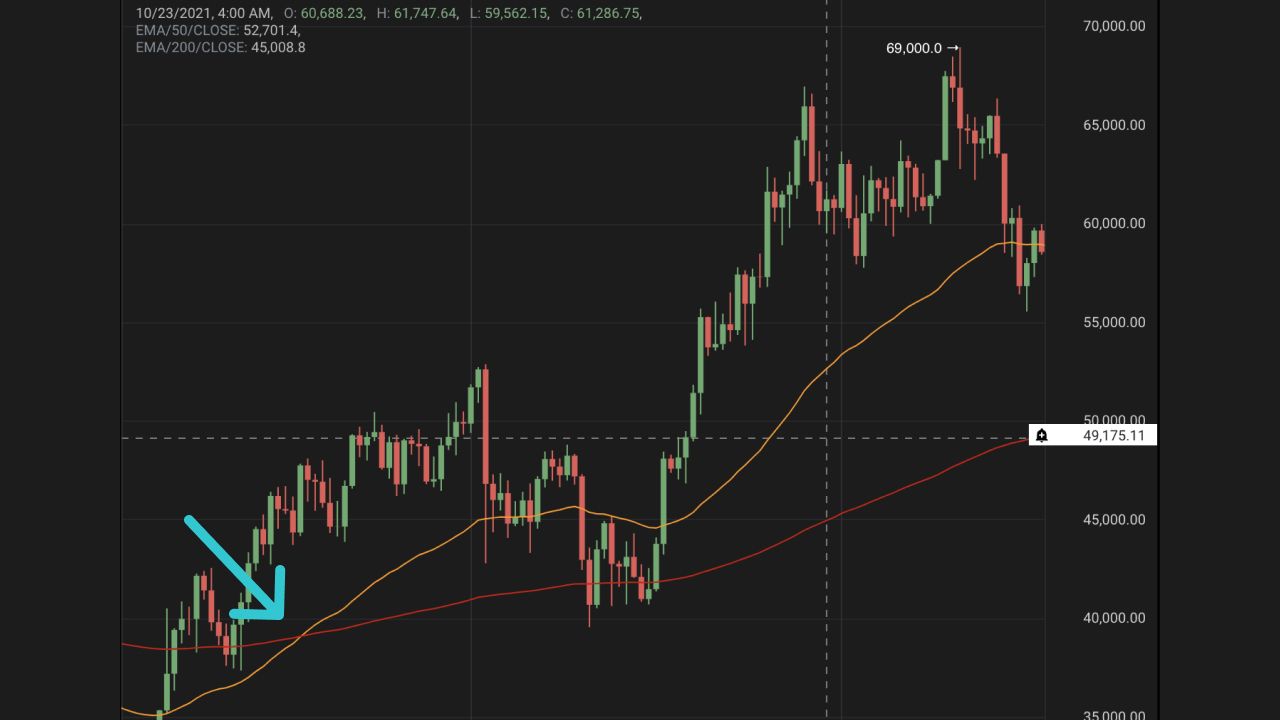
Source: TabTrader App
In the chart above, the 50-day exponential moving average (yellow) crossing above the 200-day exponential moving average (red) signals the beginning of an uptrend.
What Is the Best Setting for the EMA (Exponential Moving Average)?
The most commonly used EMAs in cryptocurrency and forex trading are the 5, 10, 12, 20, 26, 50, 100, and 200-period EMAs. Traders usually select EMA settings based on their trading style. Short-term traders prefer the 12- or 26-day EMA, while the 50-day and 200-day EMA are commonly used by long-term investors.
How Does the EMA Indicator Work?
The Exponential moving average falls under the category of trend indicators. As with the simple moving average (SMA), it is used to identify the direction and strength of market trends.
The Exponential Moving Average (EMA) vs. the Simple Moving Average (SMA)
Both EMAs and SMAs have strengths and weaknesses. As the exponential moving average (EMA) gives more weight to the recent price data, it is faster to react to sudden market movements than the simple moving average (SMA). However, traders who use SMAs when trend trading might experience fewer whipsaws (abrupt price movements against the prevailing trend) than the ones using EMAs.
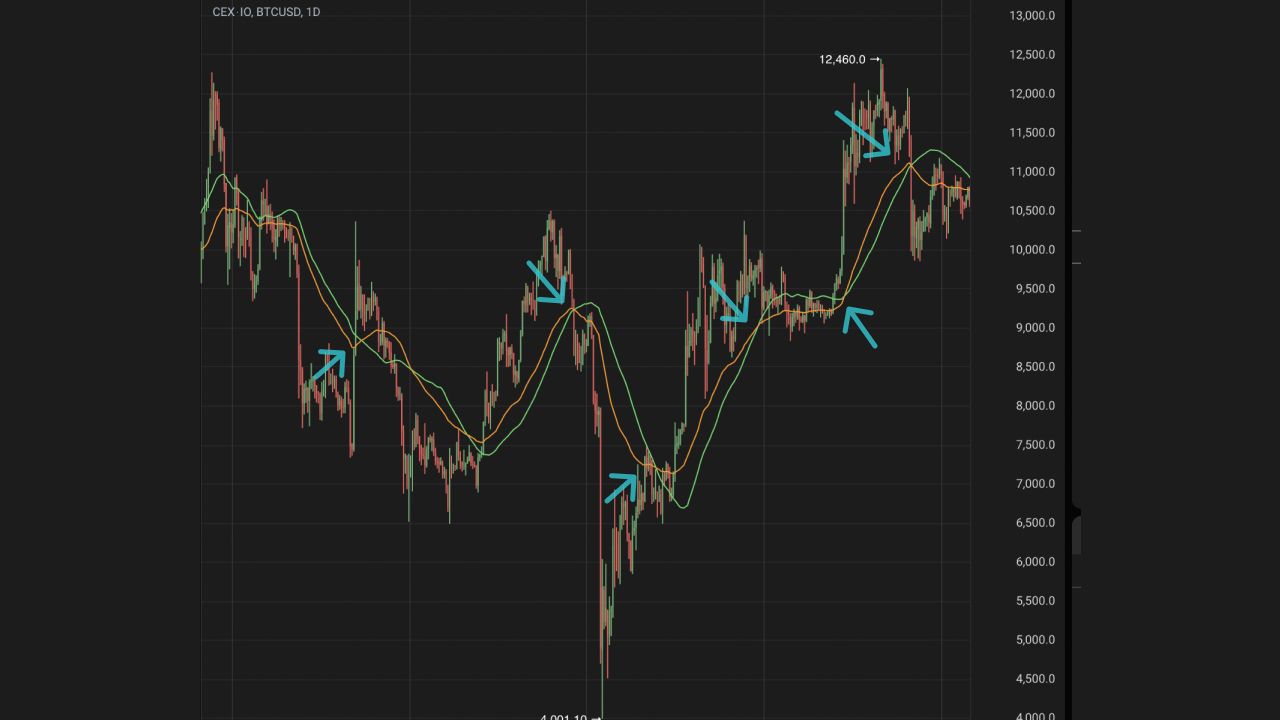
Source: TabTrader App
The chart above shows the 50-day EMA (yellow) and the 50-day SMA (green). Note how the EMA reacts faster to price changes than the SMA.
Limitations of the Exponential Moving Average (EMA)
The disadvantage of the EMA’s greater sensitivity to price change is that it is more vulnerable to false signals and getting whipsawed back and forth. Also, like the simple moving average, the exponential moving average is a lagging indicator and, therefore, can only confirm long-term trends but does not predict them.
FAQ
What is the difference between simple and exponential moving averages?
Both the SMA and the EMA measure trend direction over time. However, whereas the simple moving average calculates an arithmetic mean of data points in the period, the exponential moving average assigns a higher weight to the most recent data points.
What indicator works best with the EMA?
Investors can easily combine the EMA with other trading indicators, such as MACD, RSI, and ADX.
What is a good exponential moving average?
The choice of setting for the exponential moving average depends on a trader’s strategy. Short-term traders commonly prefer the 12- or 26-day EMAs, while long-term investors use the ever-popular 50-day and 200-day EMAs.
How to detect trends using the EMA?
The price crossing below the exponential moving average signifies a possible beginning of a downtrend, while the price crossing above the exponential moving average designates a potential start of an uptrend.


