Crypto Chart of the Week: Extreme Fear Persists Amid Partial Recovery (Feb 1–8, 2026)

Key takeaway
- Bitcoin briefly dipped below the psychological $60,000 floor on February 6, driven by macro pressures, ETF outflows, and cascading liquidations. While prices recovered slightly by week’s end, the failure to hold higher support levels has analysts questioning Bitcoin’s short-term viability as an inflation hedge.
Commentary and analysis.
Crypto investors had a tough week, while skeptics had reason to gloat as the market lost about $1 trillion in value since January 14. The selloff sped up on February 5 and 6, driven by a global shift away from risk, with tech stocks and precious metals also falling sharply.
The severity of the crash was highlighted by Strategy’s substantial $12.4 billion loss on its 713,500 BTC holdings. This erased the company’s treasury premium and sparked fears regarding its balance sheet, further fueling market panic.
For traders, the psychological damage mattered as much as the price. Once $70k gave way, over $2.7 billion in leveraged positions were cleared in a single day. Leveraged trades pushed Bitcoin below $65,000, leaving the whole crypto market in a state of extreme fear.
What’s the implication for crypto?
This week’s events wiped out gains from the past two years, turning a simple correction into a major selloff for both retail and institutional investors. Institutions quickly reduced risk, as ETF data shows. Over $1.8 billion left crypto ETFs in late January, and outflows stayed high through February 6.
Despite all this, for traders who’ve been around a few cycles, this phase is familiar. It’s usually the part where leverage disappears, price starts trading on actual supply and demand again and there is some glimmer of hope.
Bitcoin chart of the week: the $60k test
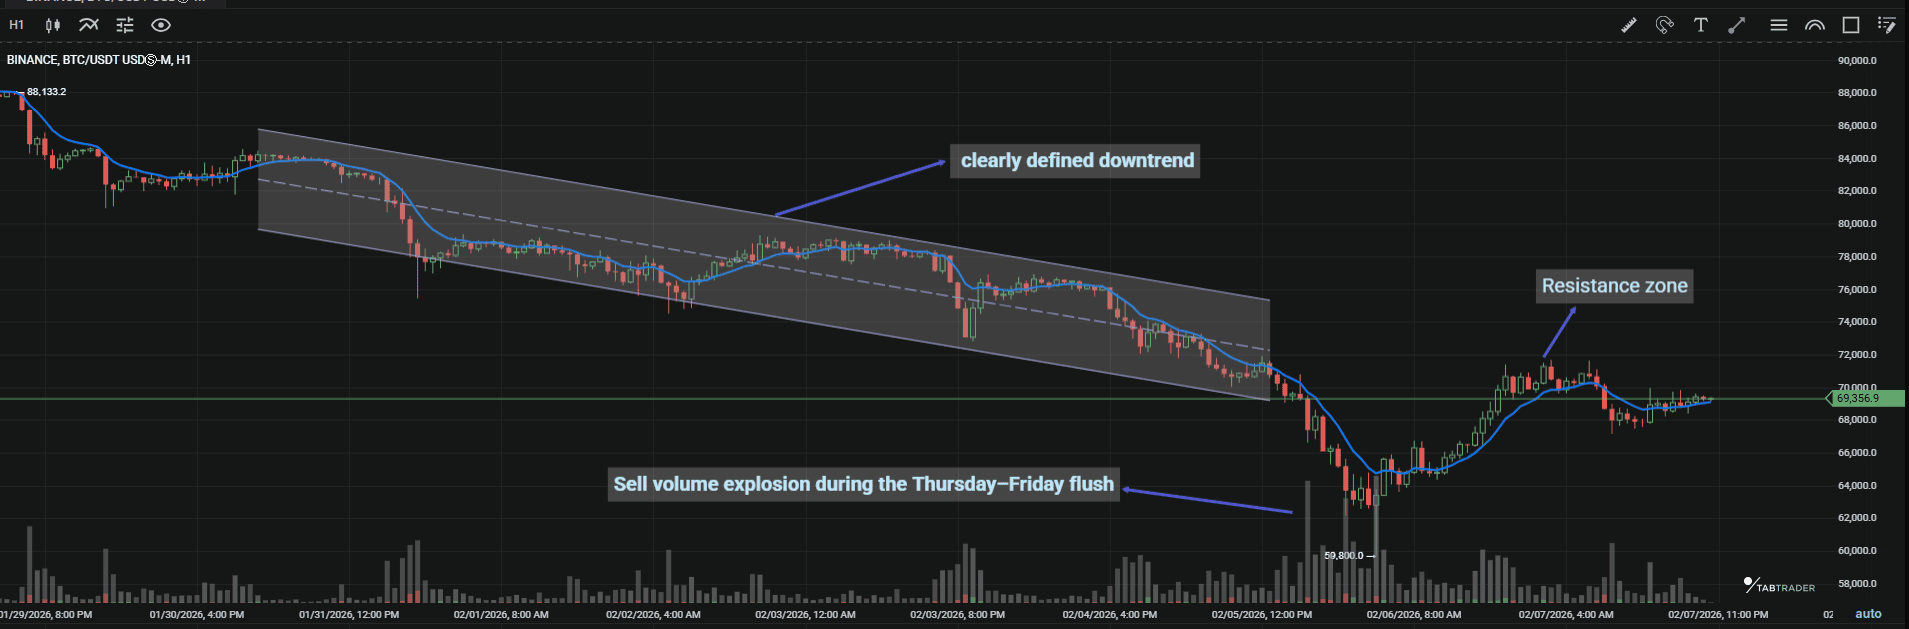
Bitcoin started the week near $75,000, dropped midweek, hit $60,000, then saw some cautious buying on February 6 and 7, recovering toward $65,000 to $70,000. Traders’ patience was tested, and some analysts think the price could fall further if $60,000 does not hold.
BTC/USDT.
- Trend and structure: The weekly chart shows a clear bearish trend, with a low of $59,800 on February 6. Technically, Bitcoin is now below its 200-day moving average and has lost about 40% from its 2025 highs.
- Key levels: $60,000 is the key level to watch. It is important both psychologically and technically. The old support range of $70,000 to $72,000 is now acting as resistance, as the weekly charts show.
- Volume: Sell volume surged during the Thursday and Friday drop. This seemed to be forced selling rather than normal distribution.
- RSI: Daily RSI collapsed into the 18–22 range. Historically, readings this low tend to precede sharp relief rallies. Those rallies are often brief, but they’re rarely subtle.
- Candles and closes: Multiple large bearish Marubozu candles printed during the drop. Buyers didn’t step in meaningfully until the price hit $60k, and even then, they were hesitant.
Ethereum: How low can it go?
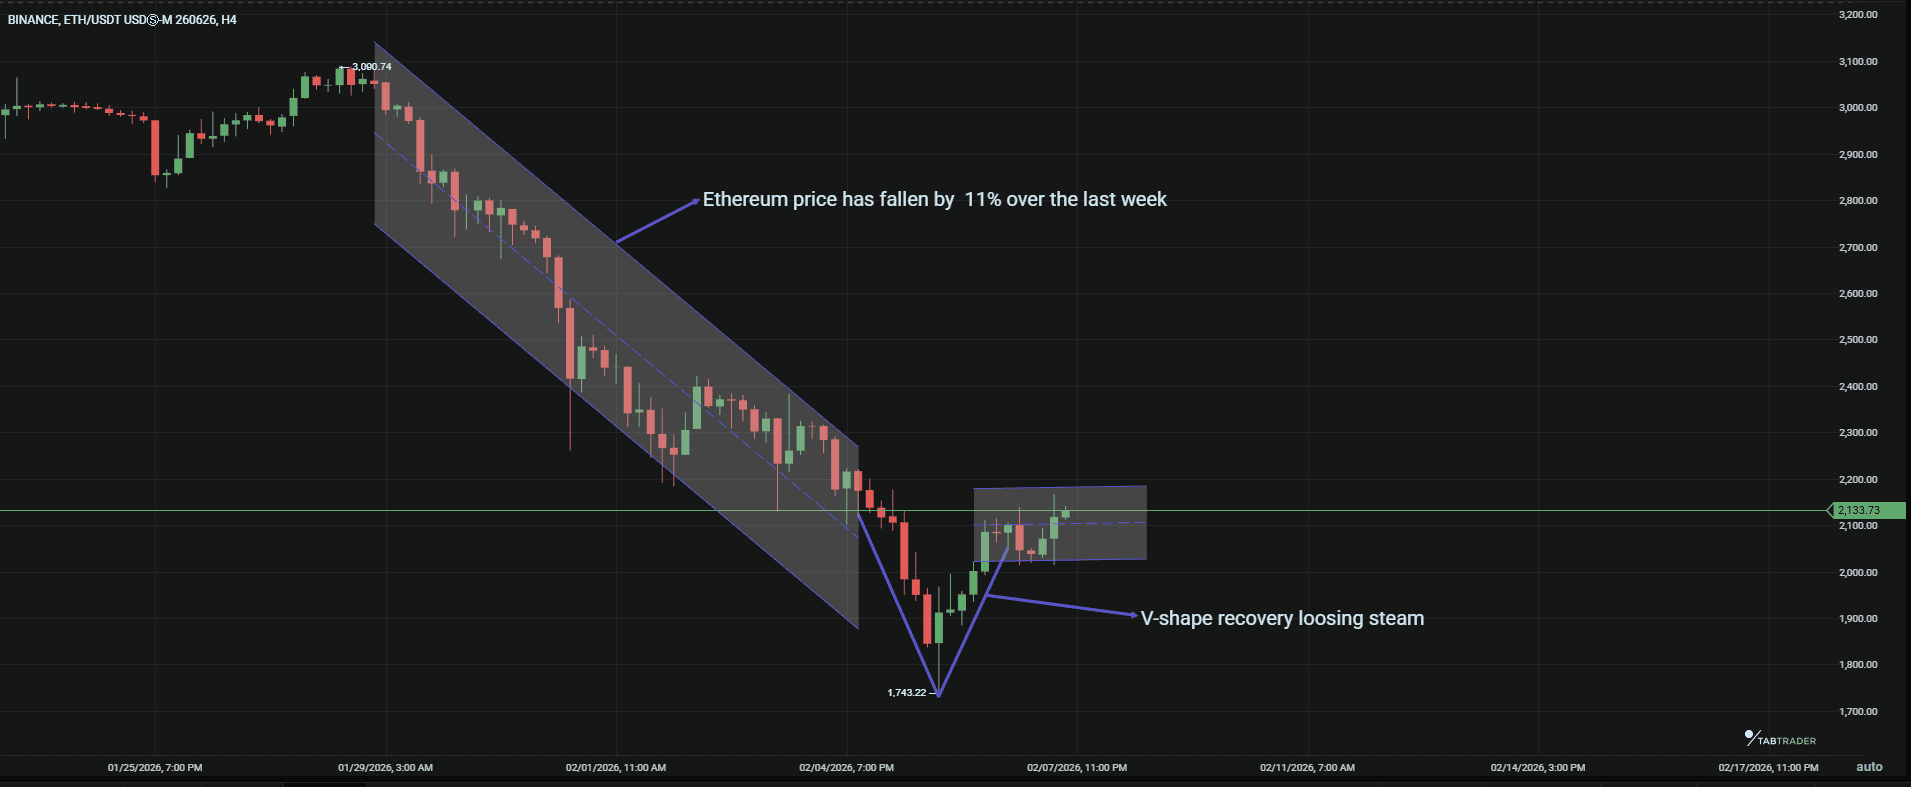
Three weeks ago, Ethereum hovered above $3,000. The weekly chart shows prices touching $1820 before recovering in a V-shape, then losing steam to trade above $2000 at the end of the week. Ethereum struggled to find a footing as capital rotated out of high-risk assets.
ETH/USDT.
- Trend and structure: ETH remains in a clear downtrend. Key pivots failed repeatedly, and relative performance continues to lag both BTC and the broader market.
- Key levels: Support sits in the $2,100–$2,250 range. Overhead resistance is stacked near $2,600, where prior attempts stalled quickly.
- Volume behavior: Spot ETH ETFs saw accelerating outflows, including a $253 million redemption on Feb 5 alone. That selling pressure showed up directly in spot markets.
- RSI: Daily RSI hovered near 20. Any stabilization will likely start with a divergence rather than an outright reversal.
Solana (SOL)
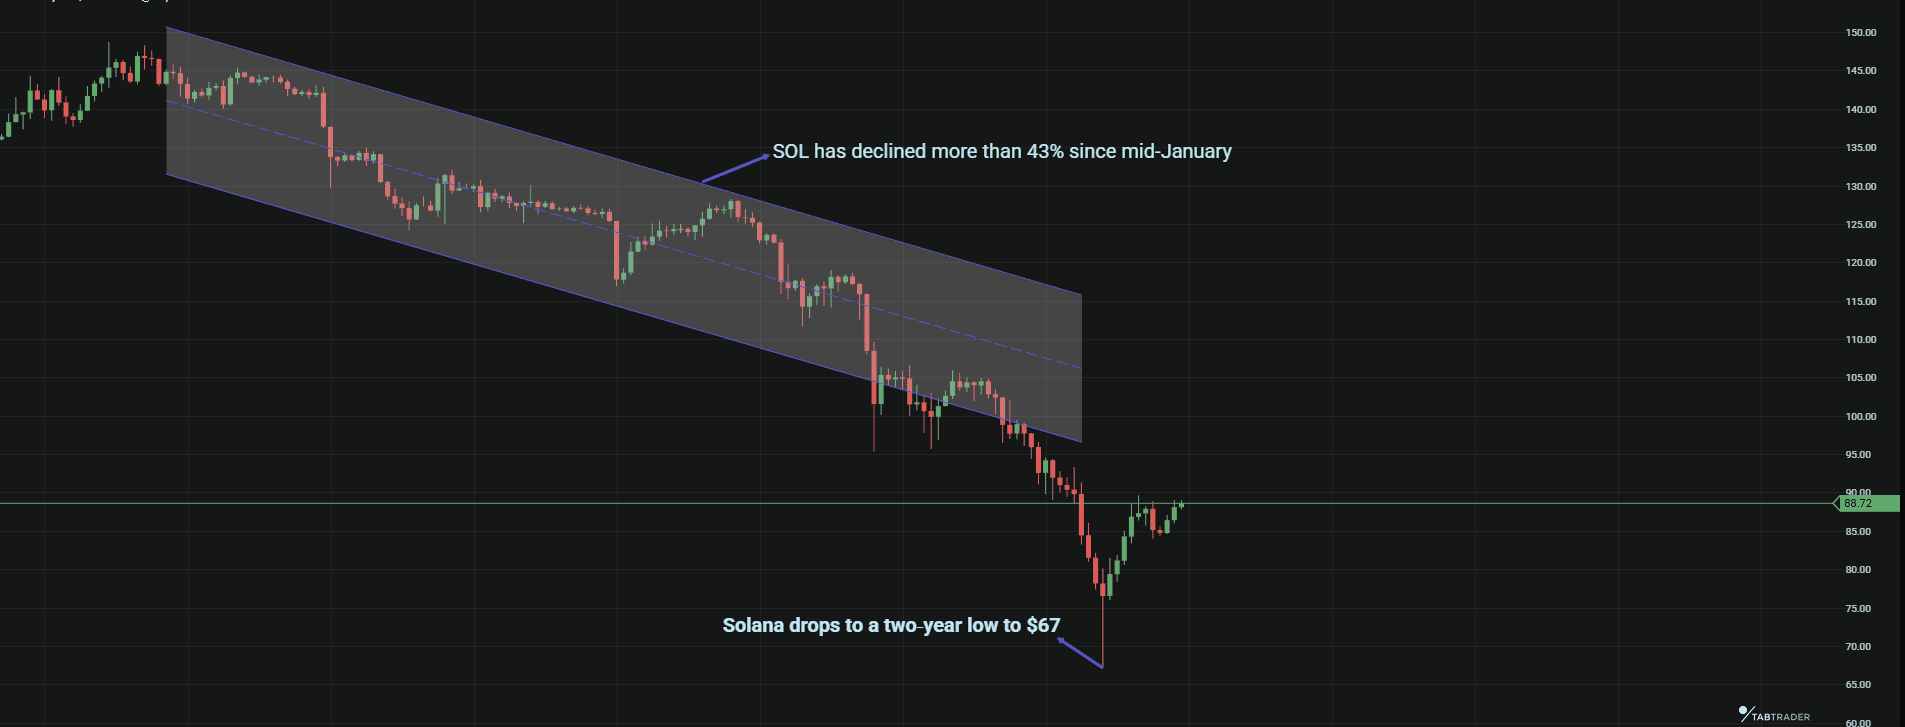
Solana was hit hard in this risk-off environment, testing the main support area set in early 2024. Overall, its price dropped more than 43% since mid-January, reaching a two-year low of $67 on February 6.
SOL/USDT.
- Trend and structure: The short-term structure broke after SOL lost $110.
- Key levels: $93 is immediate support. Resistance sits near $106, the Feb 1 high that now feels distant.
- RSI and candles: Daily RSI sits near 23, matching panic conditions elsewhere. The Feb 5–6 selloff produced wide red candles, but lower wicks are forming near support. Someone is buying down there, quietly.
Ready to trade the volatility?
Connect to over 20 exchanges from a single dashboard including Binance, Kraken, and now Bybit.
Important Note: TabTrader does not provide investment, tax, or legal advice, and you are solely responsible for determining whether any financial transaction strategy or related transaction is appropriate for you based on your personal investment objectives, economic circumstances, and risk tolerance. Tab Trader may provide information that includes but is not limited to blog posts, articles, podcasts, tutorials, and videos. The information contained therein does not constitute investment advice, financial advice, trading advice, or any other sort of advice, and you should not treat any of the content as such. TabTrader does not recommend that any digital asset should be bought, earned, sold, lent out, or held by you, and will not be held responsible for the decisions you make.