Key takeaway:
- The liquidity drain is officially over. On December 1, the Fed ended its Quantitative Tightening (QT) campaign, capping a $2.4 trillion balance sheet reduction. Coupled with a fresh $13.5 billion liquidity injection, this macro pivot sparked an immediate, sharp rebound across crypto markets.
Commentary
1. The macro-driver: end of quantitative tightening
The biggest story this week isn't a technical pattern; it's a macroeconomic event. On December 1st, the U.S. The Federal Reserve officially concluded its Quantitative Tightening (QT) program. The end of QT, coupled with a $13.5 billion liquidity injection into the banking system via overnight repo operations (one of the largest since the Covid-19 pandemic), immediately boosted risk assets such as Crypto.
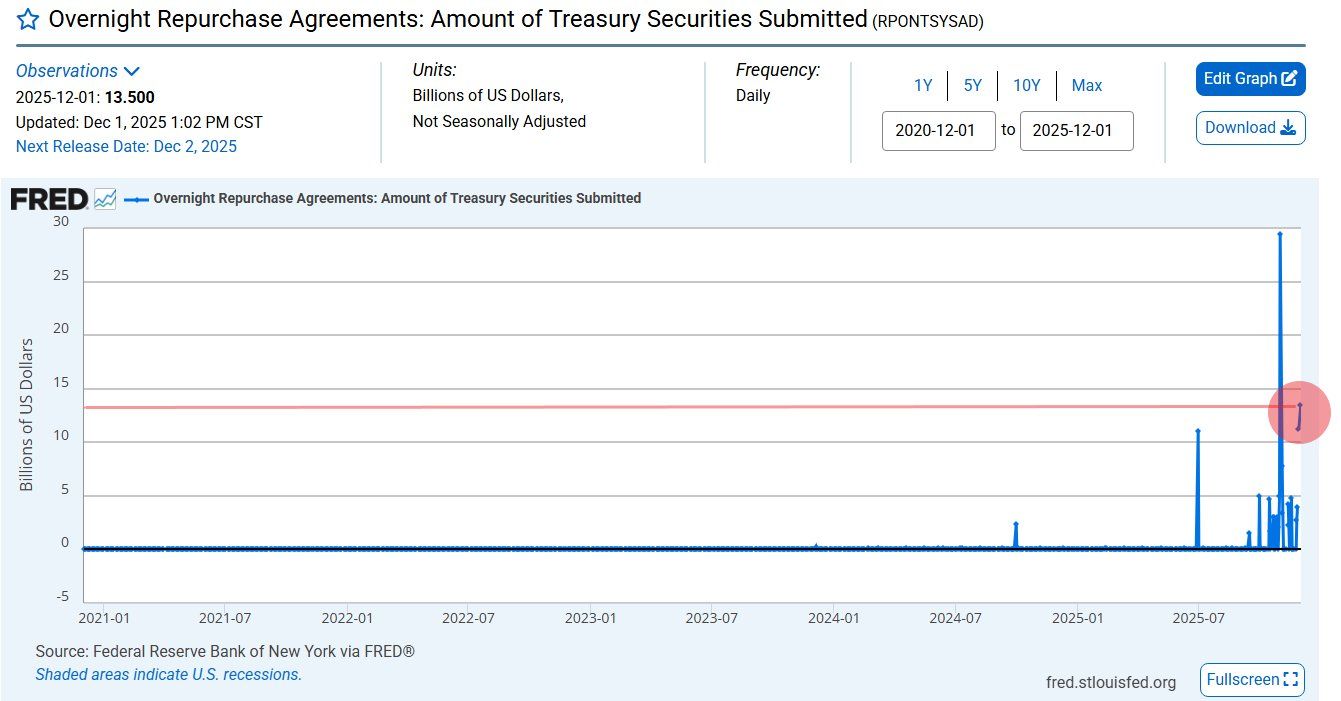
Image source: Barchart
What’s the implication for the crypto market?
Crypto markets, which were deeply pressured by the previous liquidity drain, reacted instantly. This influx of capital has fueled the simultaneous, high-percentage bounce across the major cap tokens (BTC, ETH, SOL).
Fundstrat co-founder Tom Lee remains bullish on this development; speaking to CNBC, he noted that this liquidity shift could support a market rally as assets attempt to reclaim lost trendlines.
2. Price movements of key assets
Bitcoin began the week near $86,000 and has climbed to about $90,585, gaining roughly 7.1% while reclaiming the important $90,000 psychological level.
Ethereum showed stronger momentum, rising from around $2,800 to $3,200 for an estimated 14.28% increase, breaking and closing above the $3,000 mark and confirming its relative strength.
Solana advanced from approximately $120 to $138, up about 10.5%, and successfully moved back into the $130–$140 zone.
(Get the latest price on the TabTrader chart.)
3. Bitcoin (BTC): The $94K - $95K$ Hurdle
Bitcoin's 7%+ rebound from the recent low near $84,000 highlights the strength of institutional demand at lower prices.
- Resistance: BTC is now consolidating just below the major $94,000–$95,000 resistance zone. This area is critical, as a cluster of short liquidations above it could trigger an upside squeeze if momentum continues.
- Support: The short-term trend remains constructive as long as BTC holds $92,000. Losing this support would invalidate the immediate breakout structure.
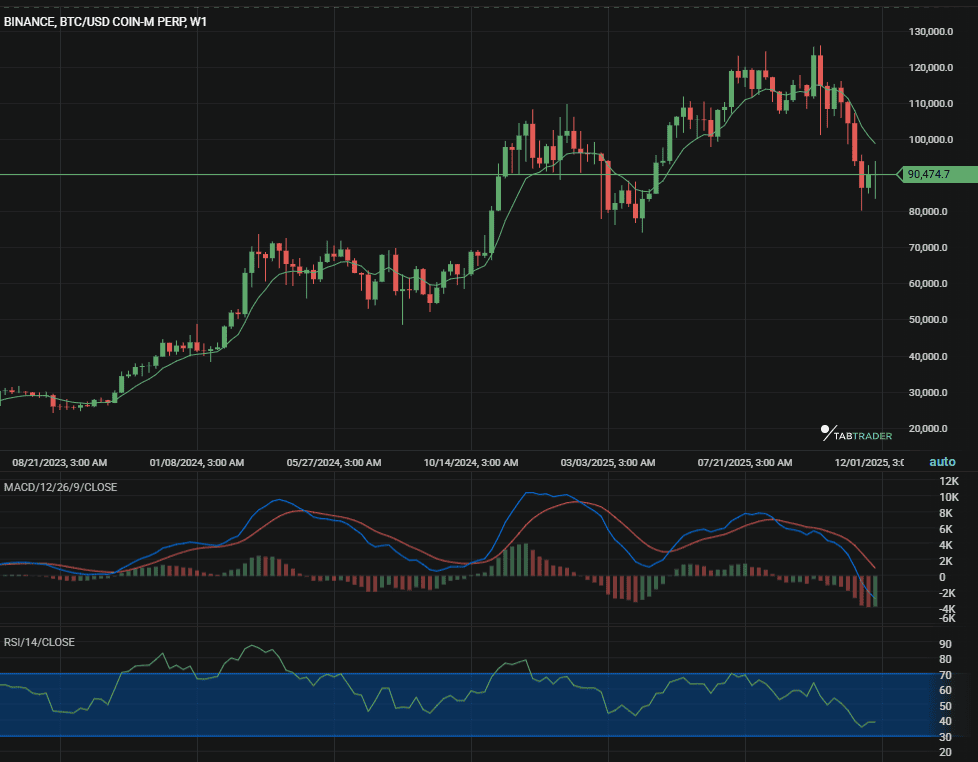
BTC/USD
4. Ethereum (ETH)
Ethereum has shown superior relative strength this week, outpacing Bitcoin. This outperformance is critical.
- ETH/BTC ratio: Traders are closely watching the ETH/BTC chart. A breakout here confirms that capital is rotating from the "safer" BTC into higher-beta assets like ETH and other large-cap altcoins.
- Technical view: The price has decisively broken the $3,200 barrier. Analysts suggest its current tightening structure points to a potential breakout, driven by strong underlying accumulation, possibly institutional in nature.
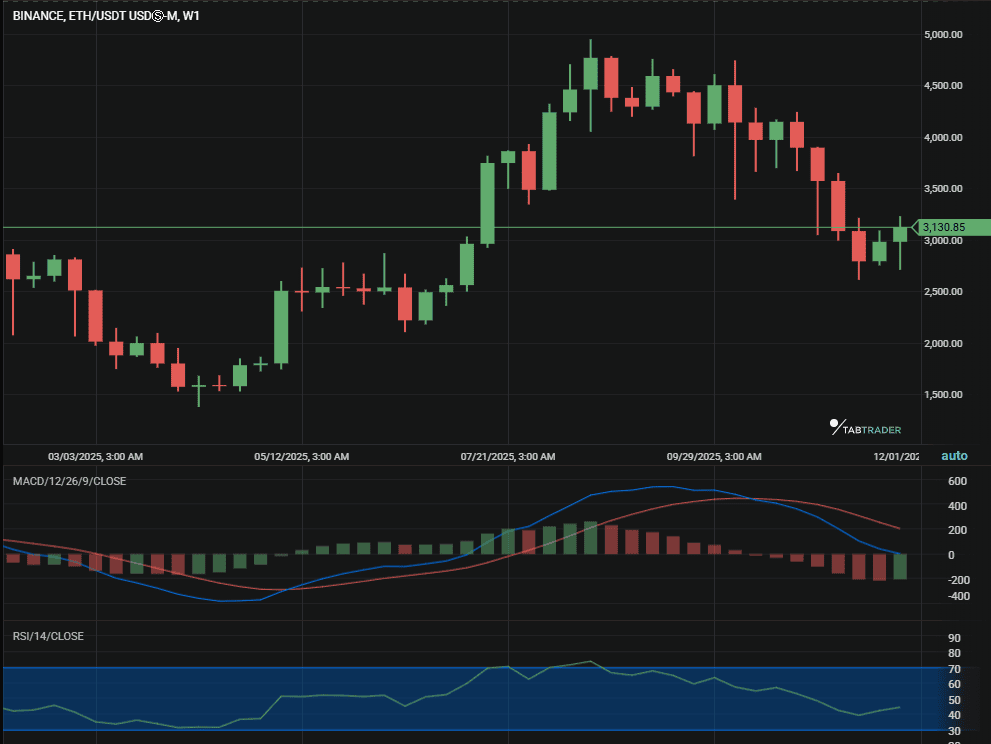
ETH/USD
5. Market Sentiment
Crypto Fear & Greed Index:
- December 1: 26 (Fear)
- December 5 : 28 (Fear)
The index increased by 2 points over the week, indicating a slight reduction in caution following the liquidity measures.
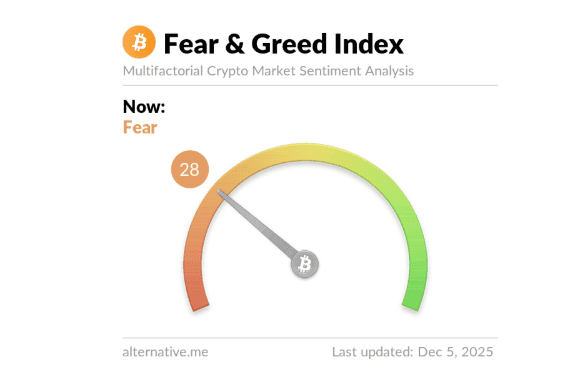
Image source: Alternative
Bottom line: volatility ahead
The synchronized recovery suggests institutional capital is flowing back . However, the macro uncertainty is far from over. The market has successfully washed out excess leverage and reset. Avoid FOMO (Fear Of Missing Out) at the tops of green candles. Instead, prioritize entries only after clear breakout confirmations above the key zones: BTC $95,000 and ETH $3,300.
Trade at the speed of the market through TabTrader, now available at 50% off
Important Note: TabTrader does not provide investment, tax, or legal advice, and you are solely responsible for determining whether any financial transaction strategy or related transaction is appropriate for you based on your personal investment objectives, economic circumstances, and risk tolerance. Tab Trader may provide information that includes but is not limited to blog posts, articles, podcasts, tutorials, and videos. The information contained therein does not constitute investment advice, financial advice, trading advice, or any other sort of advice, and you should not treat any of the content as such. TabTrader does not recommend that any digital asset should be bought, earned, sold, lent out, or held by you, and will not be held responsible for the decisions you make.