Crypto Weekly Outlook: Bitcoin Fight to Hold $68k–$70k ahead of Today’s FOMC Minutes (Feb 17-21)

Key takeaways
- Bitcoin is consolidating between $66,000 and $70,000 as extreme fear persists and macro uncertainty builds. This week’s FOMC minutes and Core PCE inflation data are key catalysts that could trigger a volatility expansion and determine whether BTC breaks higher or revisits long-term support.
Market Overview: Macro drivers and crypto Impact
The overall market is still cautious. The uptrend from earlier in 2025 has ended, and recent trading shows hesitation and a move away from risk.
Last week’s U.S. jobs report was better than expected. Unemployment held steady at 4.3%, complicating the rate-cut timeline. Markets had been leaning toward June for the first Federal Reserve cut; expectations are now drifting toward July 2026.
Meanwhile, inflation is slowing down, with CPI dropping to 2.4%. This is progress, but not enough for the Fed to change its approach. The Fed is still expected to keep rates higher for longer, which puts pressure on riskier investments.
There is also notable spillover from equities. AI-heavy tech names have seen steady profit-taking, and that rotation matters. When high-beta tech gets trimmed, crypto rarely escapes untouched. Capital has been rotating toward cash and defensive allocations as investors reassess positioning. This has contributed to crypto recording its largest capital outflow since the 2022 bear market, according to Glassnode.
Bitcoin weekly outlook
BTC continues to set the pace, consolidating in the $67,000–$70,000 zone after a bounce from February lows near $60,000–$66,000. The pullback from 2025 highs (around $126,000) has been significant, but recent price action shows demand at lower levels.
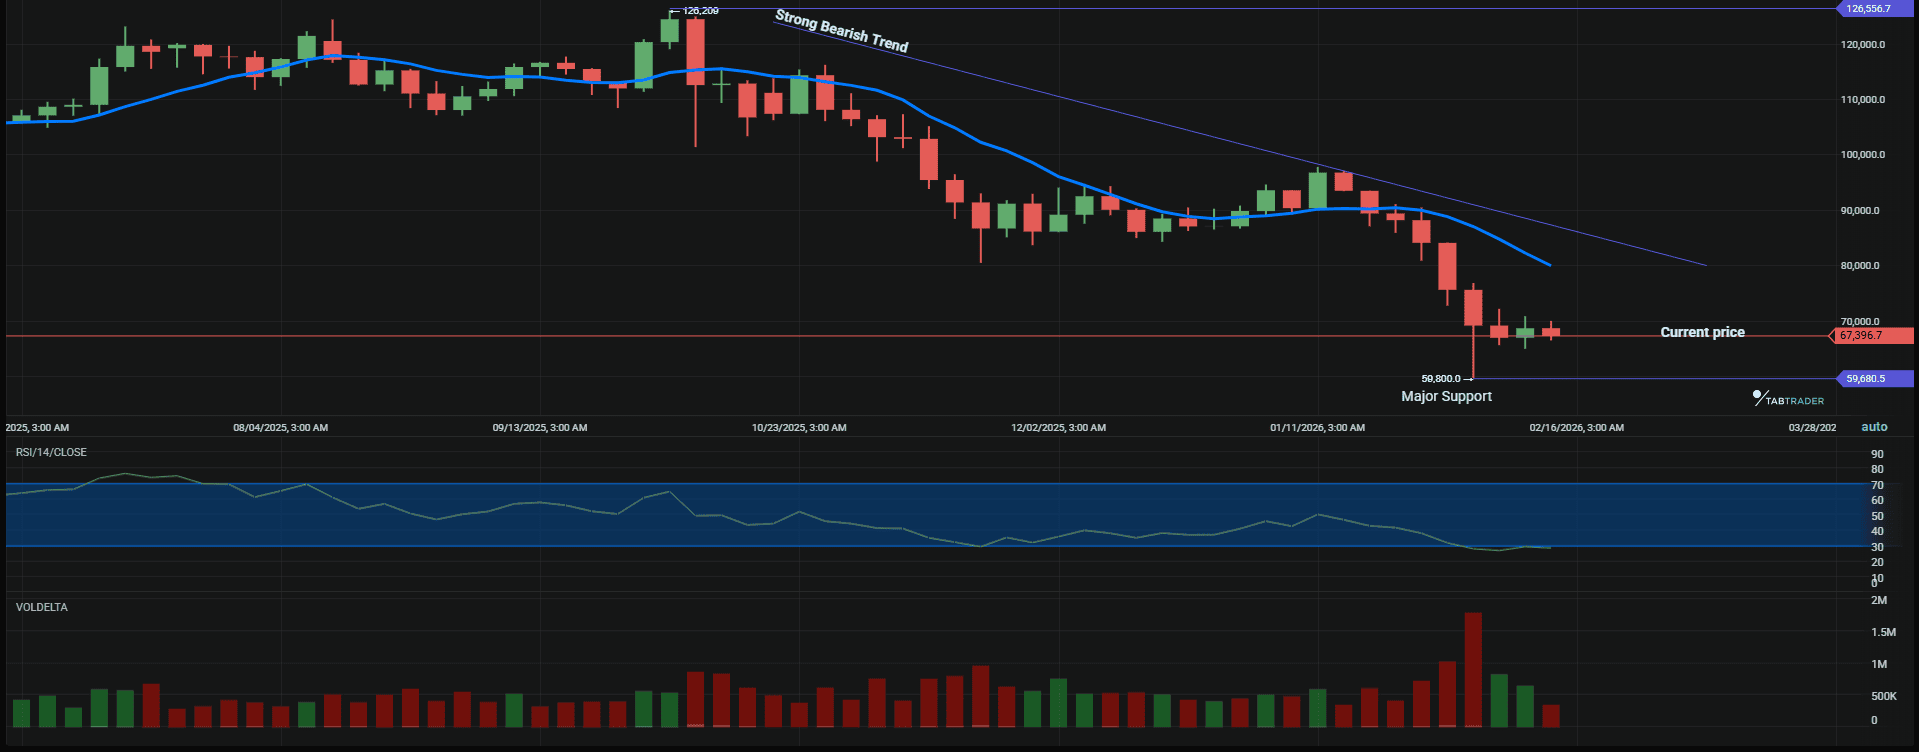
BTC/USDT
Trend structure
BTC has had four straight weeks of losses. Last week, however, the price formed a pin bar, which means buyers stepped in near the lows. This doesn’t guarantee a reversal, but it does show there is demand at these prices.
On the 4-hour chart, prices are forming a descending wedge and volatility is shrinking. This often leads to a bigger move soon. Right now, the $70k area is more about traders’ positions than market psychology. Whoever wins this level will set the tone for March.
Key levels
- Immediate Support: $66,500
- Psychological Support: $60,000
- Structural Support: $56,000 (200-week moving average)
- Resistance: $70,000–$71,800 (overhead pressure), $73,500–$75,000
The $60,000 zone remains the real stress test. If the price slips back there, it won’t be subtle.
Indicators
- RSI: Recently hit 18, signaling deeply oversold conditions. While this does not guarantee upside, it often reflects seller exhaustion in the short term.
- MACD (Daily): Curling upward. Momentum is stabilizing, though it still needs a confirmed bullish cross before calling this a trend shift.
What’s the short-term Bitcoin outlook?
In the short term, the outlook is neutral to slightly bearish. Bitcoin will likely trade between $66,000 and $71,000 unless big news, like today’s FOMC minutes, brings more trading activity. The 4-hour chart is tightening, so watch for a possible jump in volatility.
Ethereum weekly outlook
ETH is still quiet, trading near $1,995–$2,000 with only small rebounds and no strong upward moves. ETH/BTC is weak, showing there aren’t any big drivers right now. Layer 2 activity is good, but mainnet fees are low. ETH is following Bitcoin’s lead instead of setting the pace.
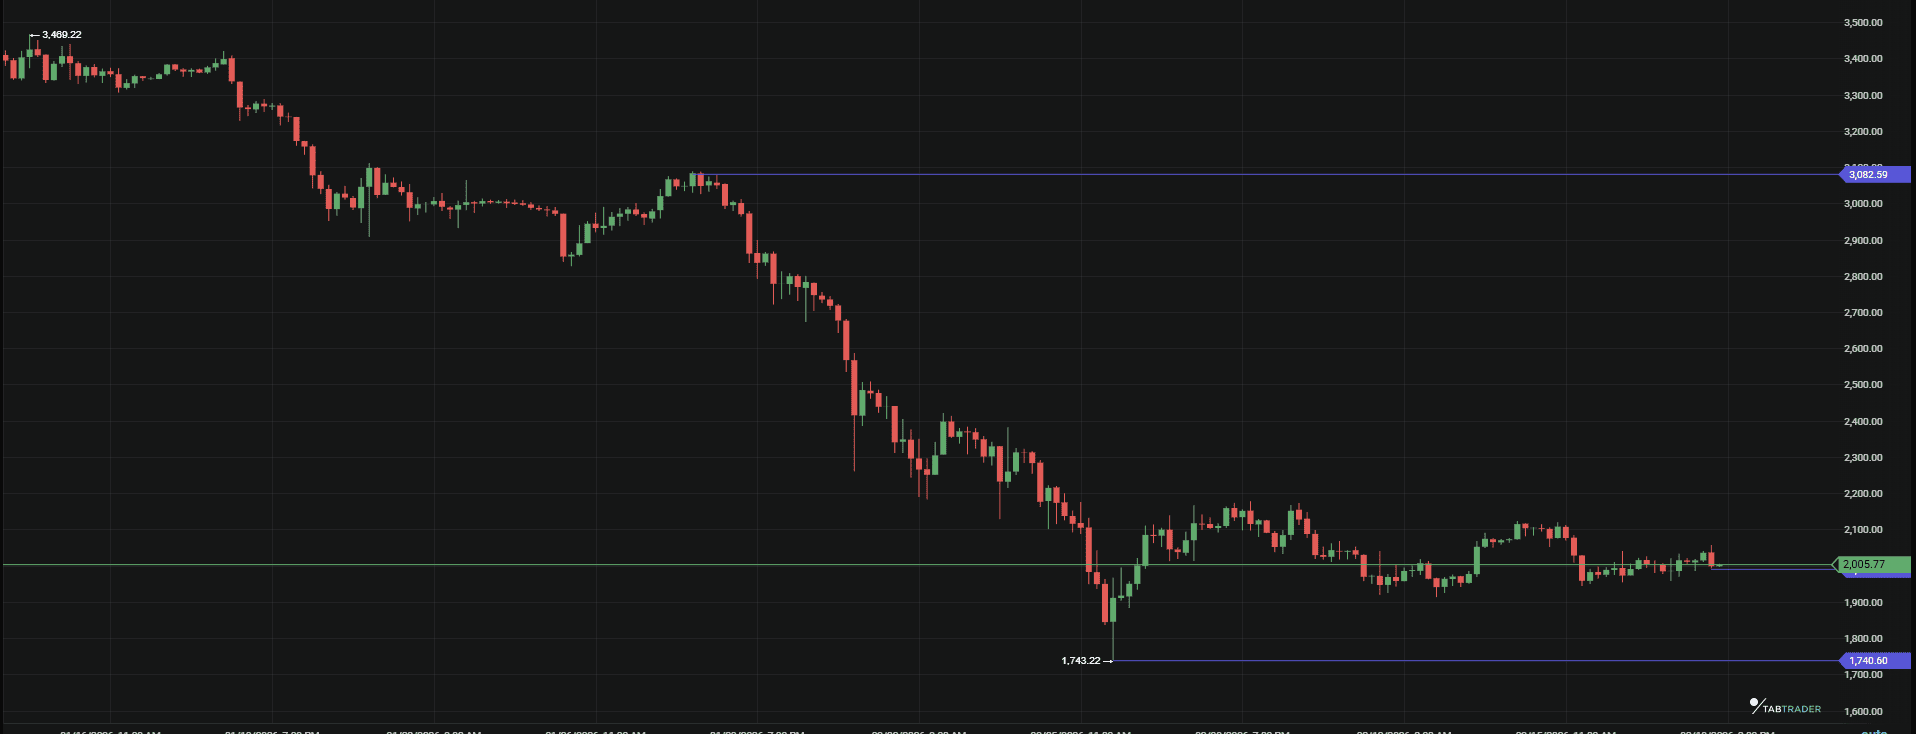
ETH/USDT
Price structure
The chart shows a soft trend. While BTC manages to defend key levels, ETH struggles to stay comfortably above $2,000. Bounces have been shallow and Follow-through buying hasn’t shown up, however Tom Lee's BitMine purchase of 40,302 ETH, valued around $116 million signals strong institutional interest.
This is mostly about how traders are positioned. There isn’t a strong reason for investors to move money into ETH right now. Layer 2 activity is still good, but mainnet fees are low, so there’s less pressure to push ETH’s value up. Traders are aware of this.
For now, ETH is reacting to Bitcoin rather than leading anything.
Key levels
- Range: $1,900–$2,100 (support) to $2,300–$2,500 (resistance)
- Below $1,900–$2,000: Downside risks accelerate, pressuring alts.
- Above $2,500: Potential relative stabilization.
Until the price breaks out of the current range, expect ETH to keep drifting. Right now, Ethereum is stuck, and in this market, that feels especially sluggish.
Major altcoin sector overview
L1s
Large-cap L1s have taken the brunt of the drawdown. ADA is down roughly 65% year-to-date, and the chart still looks heavy. SOL is holding up better on a relative basis but it hasn’t broken out of the broader risk-off gravity.
Capital isn’t rotating aggressively into this group. It’s either staying in Bitcoin or moving to the sidelines.
DeFi
Mostly range-bound. The “DeFi renaissance” narrative that circulated late last year has cooled. Yields have flattened, and without expanding TVL or fee growth, there’s no urgency behind bids.
These charts aren’t falling sharply, but traders are quick to sell into any strength and are hesitant to buy on rallies.
Gaming
This sector is the most volatile. AI-related tokens are moving almost in sync with Nvidia and the Nasdaq. When tech stocks rally, these tokens jump quickly. When tech falls, they drop just as fast.
Sector summary
At the moment, Bitcoin is leading the whole market. Most liquidity is either in BTC or stablecoins. Big L1 coins are falling behind, DeFi is quiet, and only AI tokens are showing real bounce potential during market rallies.
That doesn’t mean altcoins are dead. It means leadership is narrow. And narrow leadership tends to keep the rest of the market on a short leash.
Market metrics and sentiment
- Fear/Greed Index: 12 (Extreme Fear). This is a significant drop from the "Greed" levels seen in late 2025. Historically, "Extreme Fear" can be a contrarian buying signal for long-term spot traders.
- BTC Dominance: 59.4%. Dominance is rising. This means that even when the broader market declines, Bitcoin declines less than altcoins. Altseason is currently on hold.
Key events to watch this week
- Wednesday, Feb 18: FOMC Minutes (released today): clues on July cut commitment or higher for longer.
- Friday, Feb 20: Core PCE Price Index. The Fed’s preferred inflation gauge. A high number will push BTC lower.
Possible scenarios for the coming week
Bullish case
This will happen if BTC reclaims $70,000 and holds it with convincing volume. Not a quick wick above resistance, but sustained trade and follow-through.
If this happens, shorts get squeezed. Momentum traders re-enter. That opens the door to $75,000+. If that move holds, ETH is likely to catch a bid toward $2,400–$2,500 as relative pressure eases.
This move would be driven more by traders’ positions than by new fundamentals. It’s still a tradeable rally, but it needs enough buyers to keep it going.
Neutral case
BTC remains between $68,000 and $70,000. If this happens, the next step would be sideways movement with declining volatility. Altcoins continue to leak against BTC. Range traders can work the edges; trend traders will struggle.
Expect fake breakouts in both directions. In this kind of tape, patience matters more than prediction.
Bearish case
This BTC loses $66,500, potentially catalyzed by a hotter-than-expected PCE print. In this case, liquidity would dry up fast, and the price could fall quickly to the $56,000–$60,000 range. This area matches long-term support and the 200-week moving average.
A move like that would feel aggressive, but it would also clear out late leverage. If it happens, the selloff would probably be fast rather than prolonged.
Right now, the market sits closer to indecision than resolution. The next expansion in volatility will define how March begins.
Summary
Stability is key right now: Bitcoin holding above $67,000–$68,000 would rebuild confidence more than fleeting spikes. Extreme Fear creates bounce potential, but macro uncertainty caps upside.
Don't guess. Instead, respond to what happens. Set your alerts on TabTrader now and let the price come to you.
Important Note: TabTrader does not provide investment, tax, or legal advice, and you are solely responsible for determining whether any financial transaction strategy or related transaction is appropriate for you based on your personal investment objectives, economic circumstances, and risk tolerance. Tab Trader may provide information that includes but is not limited to blog posts, articles, podcasts, tutorials, and videos. The information contained therein does not constitute investment advice, financial advice, trading advice, or any other sort of advice, and you should not treat any of the content as such. TabTrader does not recommend that any digital asset should be bought, earned, sold, lent out, or held by you, and will not be held responsible for the decisions you make.