Trading Indicators Explained — Best Indicators for Day Trading

Technical indicators can help investors analyze an asset’s price dynamics and identify trading opportunities. In this article we explain what trading indicators are and how you can employ them to improve your trading strategy.
Trading Indicators Explained
Trading indicators are mathematical functions that use parameters such as historical price, volume and open interest to predict market direction. They are usually shown as lines on financial charts overlaid on price data, and serve to identify trends and key price points within the market.
Trading indicators are a crucial part of technical analysis. Combined with risk management tools, they help traders profit from fluctuations in asset prices.
Most Used Trading Indicators
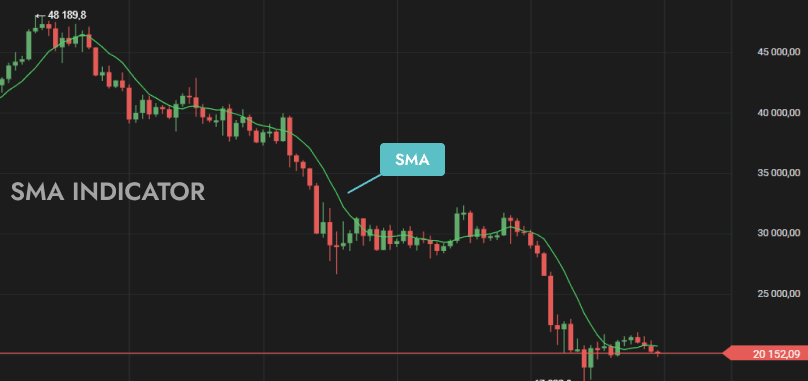
Simple Moving Average (SMA)
Simple moving average (SMA) is a technical indicator used to identify price trends. SMA smoothes a financial asset’s price action over time by calculating an arithmetic mean of a selected range of price values. SMA filters out the noise from random short-term price fluctuations and allows traders to get a clear picture of an asset’s price trajectory.
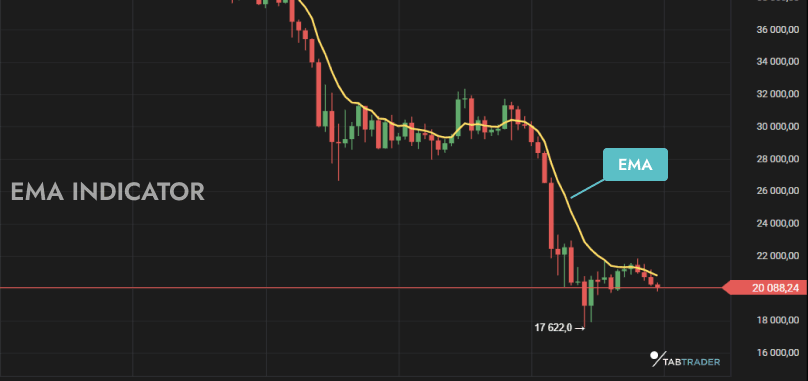
Exponential Moving Average (EMA)
Similar to other types of moving average indicator, exponential moving average (EMA) visualizes the average price of a financial asset over time. EMA is designed to improve upon the idea of the SMA by giving more weight to the most recent price data.
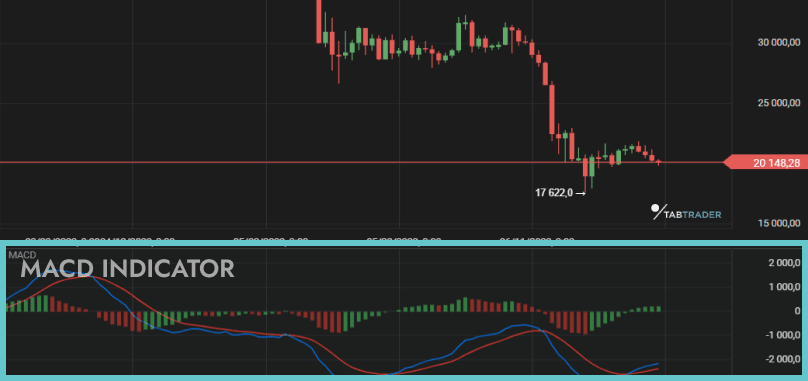
Moving Average Convergence Divergence (MACD)
Moving average convergence divergence (MACD) is a trading indicator used to identify changes in momentum of a market trend. It is plotted as an oscillator at the bottom of the price chart and shows the strength of the prevailing trend along with signaling its possible reversal.
The MACD line is calculated by subtracting the 26-period exponential moving average (EMA) from the 12-period EMA. The MACD line crossing above the signal line (a 9-day EMA of the MACD) is commonly interpreted as a bullish sign, while crossing below is considered bearish.
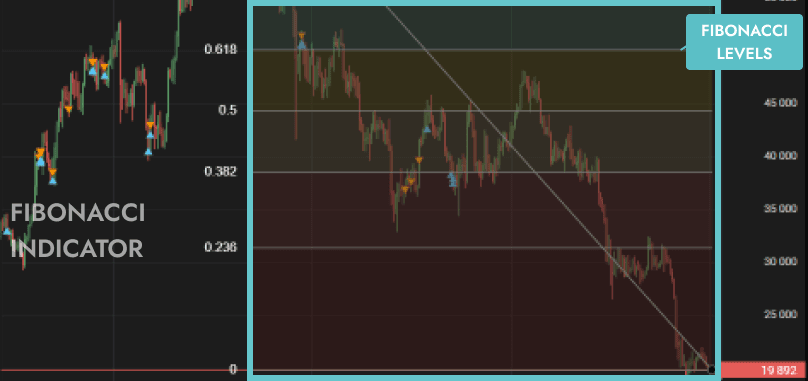
Fibonacci Retracements
Fibonacci retracements are a method of technical analysis for identifying an asset’s support and resistance levels.
It works by taking two extreme points on a financial chart and splitting the vertical distance between them into key Fibonacci ratios: 23.6%, 38.2%, 50%, 61.8% and 100%. Horizontal lines drawn through each of the detected points indicate possible support and resistance levels.
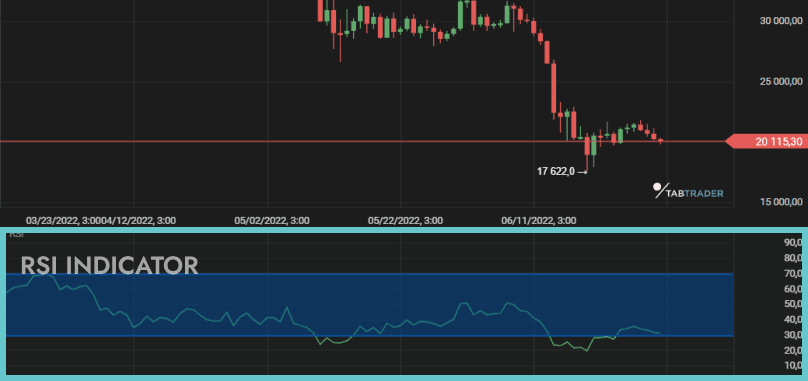
Relative Strength Index (RSI)
Relative strength index (RSI) is an oscillating indicator that allows investors to gain an insight into an asset’s price momentum and evaluate its potentially overbought or oversold status. RSI compares the magnitude of an asset’s recent gains and losses.
The RSI indicator value is calculated using the following formula:

where the Relative Strength (RS) value is average price gains divided by average price losses over a specified period of time. RSI over 70 indicates that the asset may be overbought, while RSI under 30 suggests it is oversold.
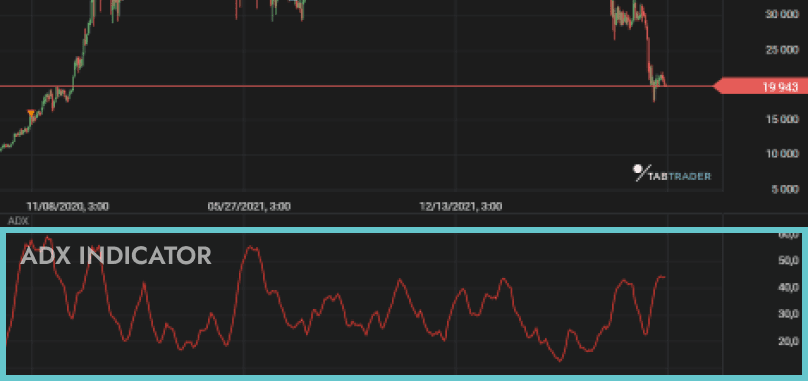
Average Directional Index (ADX)
Average directional index (ADX) measures the strength of a price trend. ADX can take values from 0 to 100, with readings below 20 usually indicating a weak trend and readings above 50 indicating a strong trend.
ADX calculations are based on a moving average of price range expansion over a given period of time. ADX indicator consists of three lines: negative directional indicator (-DI), positive directional indicator (+DI) and ADX line.
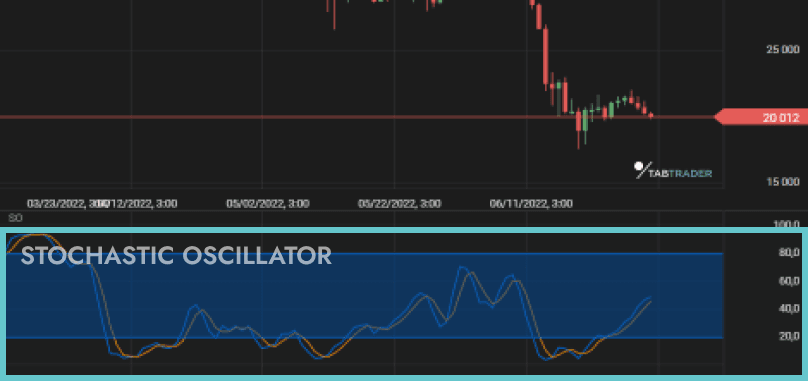
Stochastic Oscillator
The stochastic oscillator predicts possible price reversals by comparing a financial instrument’s current closing price to its price range over a given period. Similar to the RSI indicator, it generates overbought and oversold signals and uses a 0–100 range of values.
A reading above 80 suggests that the instrument is overbought whilst a reading under 20 points to it being oversold.
The stochastic oscillator plots two lines: “%K” and “%D”. %K is calculated using the following formula:

where:
С is the current closing price;
Ln is the lowest closing price in n periods;
Hn is the highest closing price in n periods.
%D is usually defined as a 3-period moving average of %K.
Standard Deviation
The standard deviation indicator is a statistical measure of market volatility. It shows an asset’s price divergence from its mean value and is calculated as the square root of variance. Using standard deviation a trader can understand the extent to which a set of asset prices is spread out relative to its average value.
A high standard deviation indicates high asset volatility, while a low standard deviation is associated with relatively stable markets.
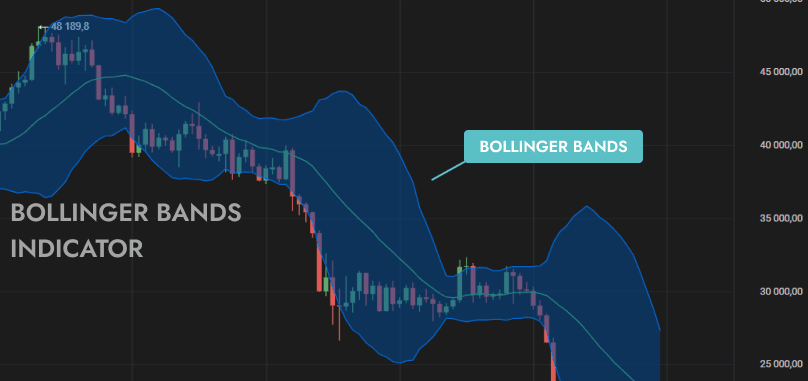
Bollinger Bands
Bollinger bands are a technical indicator that helps traders detect trends and measure asset volatility. Bollinger bands are composed of three lines: a simple moving average, a lower band and an upper band. The upper and lower bands are created by adding and subtracting standard deviation from the moving average.
Bollinger band width responds to asset volatility. Narrower bands indicate less volatility while a wider one points to higher volatility. As periods of low volatility are typically followed by periods of high volatility, Bollinger bands can be used to predict price trends. Under normal conditions, the price of an asset remains within the Bollinger bands almost all the time.
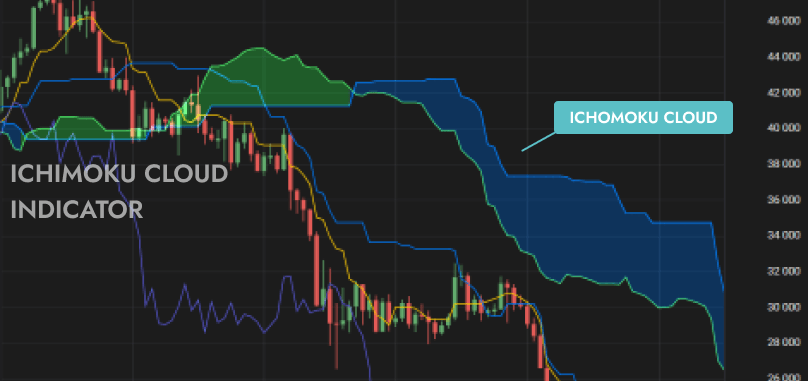
Ichimoku Cloud
The Ichimoku cloud technical indicator displays support and resistance levels, price momentum and trend direction in one view.
The Ichimoku cloud is comprised of five lines: the Conversion line (9-period average), Base line (26-period average), Span A ((Base line + Conversion line)/2), Span B (52-period average) and Lagging Span (closing prices 26 periods behind the latest closing price).
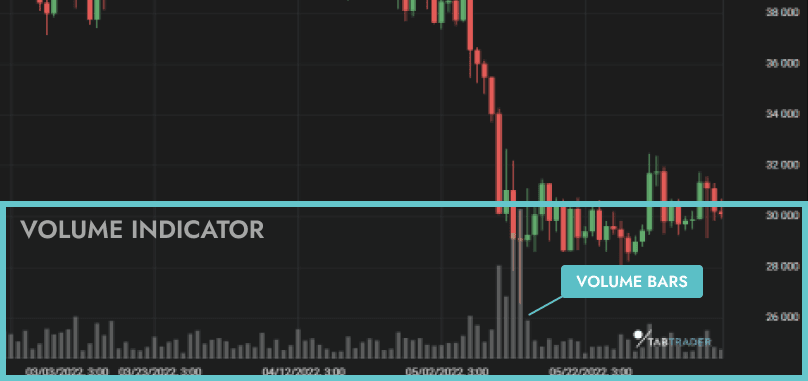
Volume
An asset’s trading volume is the amount of asset units traded during a given period of time. Volume indicators are used to evaluate the significance of a market move. A high-volume market move is considered more credible than a low-volume market move.
Trading Indicators-Based Strategy
- Indicator-based trading relies on technical indicators to predict market direction and identify significant price points for financial assets.
- A trading strategy is a set of rules for buying and selling, aimed at bringing profitable returns. Indicator-based trading strategies are frequently designed using multiple indicators to provide traders with an opportunity to assess market conditions from different angles.
- No one trading indicator or strategy can 100% guarantee a particular market move.
- Indicator-based trading strategies vary depending on the trader's goals and risk tolerance.
Types of Indicators

Trend Indicators
Trend indicators serve to identify the direction of a market trend. The most well-known trend indicators are moving averages (simple moving average and exponential moving average) and MACD.
Momentum Indicators
Momentum indicators determine the speed of a financial asset’s price movement. They serve to measure trend strength and predict its reversal. Relative strength index (RSI) and stochastic oscillator are two examples of a momentum indicator.
Volatility Indicators
Volatility indicators are technical analysis tools that measure the degree of asset price variation over time. The most common volatility indicators are Bollinger bands and standard deviation.
Volume Indicators
Trading volume is an asset’s total number of units traded over a given time period. Volume indicators serve to measure trend strength and direction. The Volume-weighted average price (VWAP) and volume-weighted moving average (VWMA) are among the most commonly used volume indicators in trading.
Trading Indicators FAQ
What are good trading indicators?
- Simple moving average (SMA) is a trading indicator used to identify a market trend. SMA is one of the most frequently used technical indicators.
- Exponential moving average (EMA) visualizes the average price of financial assets over time. It improves on the idea of SMA by giving more weight to recent data points.
- Moving average convergence divergence (MACD) is a momentum oscillator. Along with determining trends MACD identifies the price momentum of financial instruments.
- Relative strength index (RSI) is a momentum indicator that compares the magnitude of recent gains and losses over time.
What are the 4 types of indicator?
The four types of trading indicator are: trend indicators, momentum indicators, volatility indicators and volume indicators.
What is the most popular trading indicator?
The most popular trading indicator is simple moving average (SMA).
How do you read MACD and RSI?
The MACD line crossing above the signal line is interpreted as a bullish signal, while the MACD line crossing below the signal line is often seen as the beginning of a bearish trend.
An RSI value over 70 signals that the asset may be overbought, while RSI under 30 points to oversold.


