Updated Dec.17th, 2025
Bollinger bands are a charting tool which tracks the volatility and price action of financial assets.
One of the most popular indicators for traditional currencies and cryptocurrencies, Bollinger bands also help traders time market entries and exits, and identify long-term and short-term trends.
What are Bollinger Bands?
Bollinger Bands are a mathematical chart indicator which uses standard deviation to gauge an asset’s volatility.
Named after analyst John Bollinger, who devised them in the early 1980s, Bollinger Bands have achieved universal success as a trading tool, and have also spread to cryptocurrency markets.
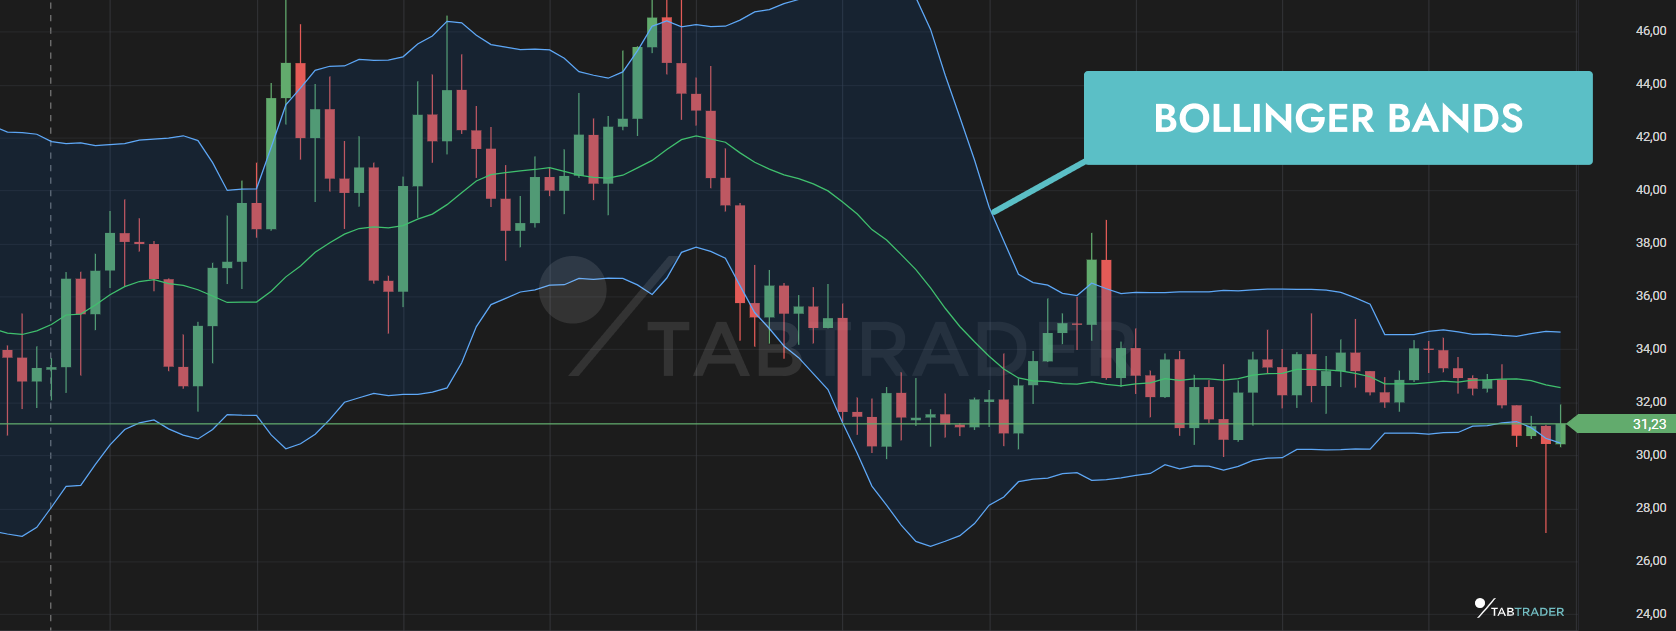
Bollinger Bands use the 20-period moving average of an asset as a midpoint, and normally surround this with two lines of two standard deviations up and down. The resulting three trendlines give the bands their name.
Asset price volatility is then analyzed based on price behavior relative to these bands, which expand and contract over time.
Aside from volatility, Bollinger Bands are also useful for identifying price trends, for example continuation or reversal. They can also tell traders whether an asset is trending or consolidating, or due for a volatility breakout. From this data, traders can also infer potential price targets and shape their trading strategy accordingly.
Bollinger Bands, volatility and crypto
The most widely-known use of Bollinger Bands is as a volatility indicator.
The bands use the 20-period simple moving average of an asset, and by default, the upper and lower bands use two standard deviations to create the classic trading channel visible as a result.
Those parameters can be changed. Increasing the standard deviation, for example, will result in price leaving the zone covered by the bands less often. Conversely, reducing the standard deviation factor will narrow the bands’ scope and cause the price to exit its range of ‘normal’ volatility more often.
Put simply, traders are looking for periods in which price action behaves exceptionally unlike it does the majority of the time. With increased standard deviation, they can deploy ‘safer’ bets based on volatility — it is more likely that the asset is either overbought or oversold once it crosses the lower or upper band, respectively.
This leads to an important observation about Bollinger Bands and volatility. Just because price is at the upper or lower band, it does not imply a buy or sell signal for the asset. It is more accurate to say that compared to historical norms, the asset is overbought or oversold.
As such, entering or exiting trades based solely on the fact that one of the bands has been reached is not a sound strategy. This is especially pertinent to crypto trading, as Bitcoin (BTC), Ethereum (ETH) and other altcoins are notorious for episodes of heightened volatility compared with traditional financial assets.
Bollinger Bands, however, are one of TabTrader’s most popular crypto trading indicators. To find out the rest, check out our dedicated article.
How to use Bollinger Bands in crypto trading
Given that cryptoassets tend to be more volatile more often, Bollinger Bands can offer useful support and resistance data, as well as potential price targets.
The Bands expand and contract according to price action, and therefore offer what is called ‘dynamic’ support and resistance levels — floors and ceilings which are constantly on the move. This allows traders to buy and sell at levels which have a higher probability of functioning as support and resistance, respectively.
Nonvolatile markets
Even cryptocurrencies, notably the more liquid assets such as Bitcoin, can see extended periods of very low volatility, however. In such a scenario, Bollinger Bands are still useful, despite volatility being much less obvious.
Here, the Bands will be narrower — they will ‘hug’ the 20-period simple moving average with less room either side. For low-risk trades, support and resistance levels will thus be clearly marked by standard deviation.
Volatile or trending markets
What happens when a cryptocurrency is trending up or down?
As is often the case, crypto tokens such as Bitcoin and Ethereum can break out of a range very quickly and go on to lose or reclaim multiple levels which had previously stayed untested, often for an extended period.
In this case, the Bollinger Bands will expand to accommodate more volatile price action. Just because price touches the upper or lower band, however, does not mean that it is a good time to sell or buy.
This is because once price reaches either boundary, it could continue falling in line with the expanding Bollinger Band, creating a series of higher highs or lower lows which instantly put a trader at risk.
The least dangerous scenario is that a trade misses out on profitability, while a losing trade — especially if leveraged — could quickly cost the trader a significant amount. For more information on leverage, check out the TabTrader Academy article here.
To mitigate such risks, traders can use specific order types on exchanges such as stop-loss and take-profit, all of which are also available through the TabTrader app.
Best Bollinger Bands Trading Strategies
Bollinger Bands allow traders to inform their strategies in multiple ways — not just with volatility cues.
Below are two examples of the most popular Bollinger Bands trading strategies which can be just as easily applied to crypto as traditional assets.
Overbought and oversold strategy
This is basically the central concept of Bollinger Bands trading described previously in this article.
As the asset price approaches the upper or lower band, it can give an ‘overbought’ or ‘oversold’ signal, respectively. Traders can thus choose to sell or add to their positions as needed.
This concept works better in sideways markets during periods of low volatility and narrow Bollinger Bands.
In trending markets, relying purely on band touches with the belief that the market will ultimately settle down and return closer to the 20-period simple moving average — so-called mean reversion — is much more risky. Here, traders should consult additional indicators to backtest whether a particular price point is valid as a buy or sell signal.
Squeeze strategy
The Bollinger Bands squeeze strategy works well during periods of nonvolatile sideways price action.
With the Bands close together, providing support and resistance signals, the belief among market participants will increasingly shift to a breakout occurring up or down. The longer the Bands stay tight around the 20-periods simple moving average, the more likely a decisive up or down move will come next.
As such traders can use sideways periods to deduce which direction the asset is likely to go and plan accordingly.
Increasing volume is a key accompaniment to the squeeze strategy, as strong volume supports trend direction and longevity.
Conclusion
Bollinger Bands are a very useful indicator for gauging asset volatility — regardless of how typically volatile an asset is. This makes them a great indicator for cryptocurrency traders, but Bollinger Bands offer much more than simple volatility signals.
Traders can also use them to determine market entry and exit points, as well as an asset’s long-term trend. Bollinger Bands can thus influence and inform entire trading strategies.
TabTrader offers the Bollinger Band indicator as standard as part of its suite of chart indicators. Simply download the TabTrader app, select a ticker and add the Bollinger Bands from the indicator list. You can use both on your mobile and desktop.


