
What is a Trendline?
A trendline is a chart feature used to determine the overall direction and trajectory of the price of an asset.
Trendline Definition
Trendlines are one of the most fundamental aspects of financial analysis. Using a simple line or pair of lines on a chart — hence ‘trend line’ — traders can see whether an asset is in an uptrend or downtrend and how strong that trend is.
What Does it Show?
Trendlines fulfil many functions and are used extensively by traders to analyze price behavior. These functions include showing traders whether an asset is in an uptrend or downtrend, as well as how strong that trend is.
A trendline can be used on its own or combined with more to create a one or more ‘channels’ which show whether price action at a given time is more or less typical of the asset overall. Channels also highlight likely important support and resistance levels for the chart involved.
How it Can be Used in Trading
Using this information, traders can then decide whether to enter or exit a position at a specific price. They can also gain some insight into the risk involved in doing so from the point of view of profits or losses, both realized and unrealized.
For example, if a trader uses two trendlines to create a channel and finds the current spot price is outside that channel, they may decide to sell (if the top trendline has been breached) or hold their position (if the bottom trendline has been breached).
Trendlines give context to charts and can be useful on both long and short time frames.
Trendline Examples
The following are all examples of linear trendlines — the most frequently-used variety by regular traders.
Uptrend Line
Below is a 1-day candle chart showing BTC/USD on the TabTrader app. The pair is gaining, but a trader wants to know how strong the trend is and the significance of each daily low and high.
The trader identifies the outlying lows, known as swing lows (marked by the candle wicks) and joins them with a trendline. The result is a line sloping upwards, called an uptrend line, and clearly confirms the uptrend in BTC/USD.

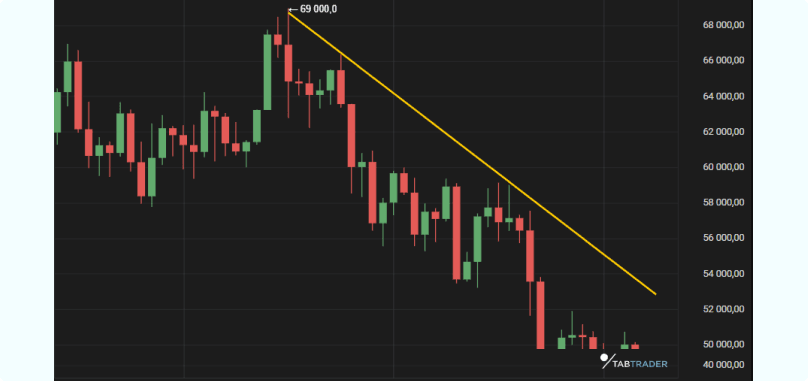
Downtrend Line
Downtrend lines work as counterparts to uptrend lines and identify to what extent an asset is trending downwards.
A trader sees BTC/USD has been losing value and plots a downtrend line above the daily candles, this time identifying swing highs instead of swing lows.
Trendline Validation
Not all trendlines are created equal. It is possible to draw any line on any chart, but its usefulness depends entirely on the knowledge of the trader.
From this comes the topic of trendline validation. A trendline is only useful if it provides real insight, and being “valid” is a key to delivering that.
Valid trendlines, for example, need to include at least three swing highs or lows and interact with them (as shown in the examples above).
Highly volatile markets can make drawing valid trendlines much more difficult, and an unstable or volatile asset can frequently violate even the best trendlines and break out of its up or downtrend altogether.
Internal Trendlines
The aforementioned volatility can make drawing trendlines all but impossible for highly volatile assets such as cryptocurrencies.
One way around this is to use so-called internal trendlines. These also seek to identify up or downtrends and potential buy and sell points, but do not cover all the swing highs or lows.
Instead, an internal trendline can cross through some candles on the chart if these are obviously extremes in an asset’s overall price activity.
On the 1-hour candle chart of Dogecoin (DOGE/USD) from Bitfinex below, an overall uptrend is shown. An internal trendline highlights a swing low which does not fit the trend and turns out to be an anomaly within the wider trend context.

Trendline Technical Analysis
As one of the most basic technical analysis tools, trendlines feature heavily in professional trading environments.
There is good reason for this — trendlines allow traders to gather important information about an asset at a glance.
One can immediately identify whether a given asset is in an uptrend or downtrend by looking at the trendline’s slope. How acute that slope is in turn provides an insight into the strength of that up or downtrend.
Not only that, but traders can then use that information together with other technical analysis tools to assess how sustainable the trend is. A strong uptrend, for example, does not necessarily imply an easy entry and risk/reward ratio.
Beyond price trends, trendlines can be used for gauging when to enter or exit an asset.
As described above, the way a trendline is drawn means that extremes in price action — swing lows on an uptrend and swing highs on a downtrend — in a specific period become obvious.
Traders then use this data to assess the likely entry or exit opportunities going forward — if the price touches the trendline once again, it is likely at support or resistance respectively.

Not all assets act within defined patterns, however, and volatility can make buying, selling and protecting profits much more difficult. Trendlines, however, can deal with a wide range of asset behavior, regardless of timeframe.
Thanks to internal trendlines, for example, anomalies in price behavior can be excluded and traders can still gauge the overall trend, along with reliable entry and exit points.
What if circumstances change altogether? Charts with well-placed trendlines also show when an asset breaks out of its previous pattern of highs and lows.
Additional analysis of support and resistance levels, along with order book data, can thus produce an idea of whether an asset is a buy or sell, even once it has crossed the trendline and continued to act outside it — beyond its swing high or low.
As with any trading tool, however, use of trendlines comes with a word of caution. Everything depends on the accuracy with which a line or channel is plotted on a chart — if the trader fails to identify suitable swing lows or highs, for example, the entire trendline can be out of place.
This has implications for price expectations and can result in the trader waiting for a buy or sell price that never comes, thus missing out on the trade altogether. The results can be even more detrimental to a trading strategy if incorrect trendlines and channels are combined with automated buy and sell orders on an exchange. If the trader enters a misguided price target and those orders never execute, the losses or missed profits can be considerable.
Trendline FAQs
What do Trendlines Mean?
Trendlines refer to chart features which track the overall trend of an asset. They appear as a straight line above or below price action data (candles).
What are Trendlines Used for?
Trendlines are used to determine whether an asset is in a form of uptrend or downtrend. They also provide insights into whether an asset is a buy or sell at a specific price, and whether a trader should choose to buy or sell at a specific price in the future.
What are Trendlines in Stocks?
Trendlines fulfil the same functionality across various asset classes. Stocks are no different, allowing traders to inform their trading strategy accordingly. Trendlines can also feature on stocks index charts (for example the S&P 500), and are useful in tracking historical anomalies over longer timeframes.
Can a Trendline Predict Future Market Prices?
A trendline does not make predictions itself; it offers an idea of where an asset is going and where buying/ selling will likely be to the trader’s advantage (depending on their strategy). Trendline data can vary significantly depending on the skill and experience of the trader who plots them on a given chart.


