About Chart
Chart
A chart is a graphical representation of price movement that can be created via the use of various components such as trend lines, candlesticks, bars, Heikin Ashi candles and more.
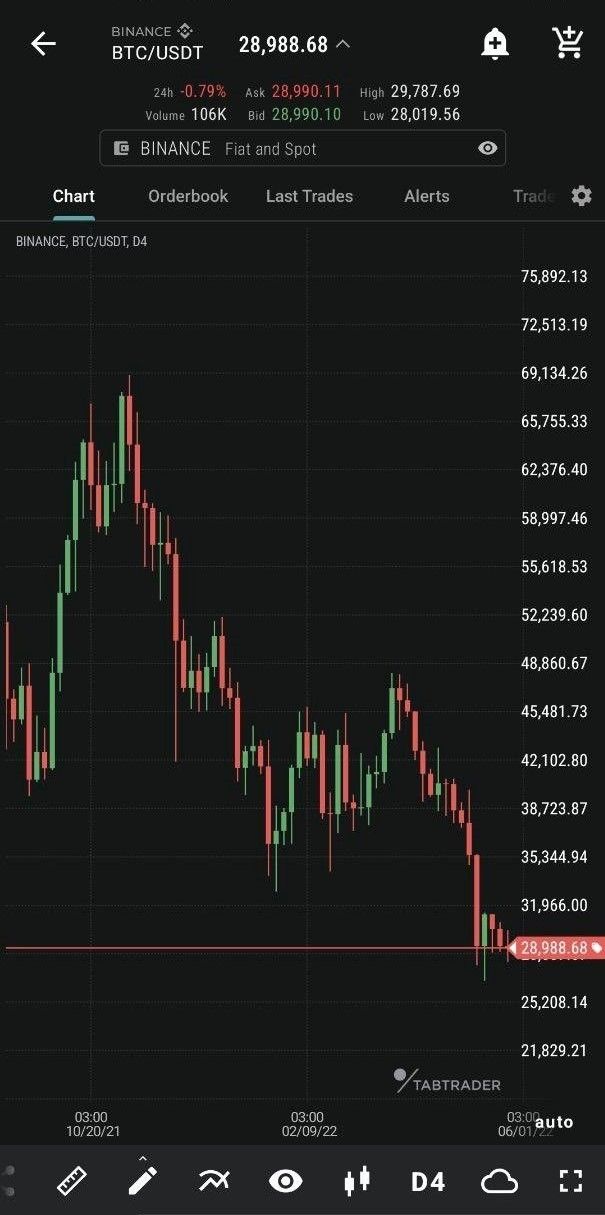
Chart view
TabTrader has its own charts (we don’t use third party charting).
All the basic indicators of market changes are displayed on the dashboard: market price, upper and lower price levels, bid/ ask, 24H percentage change and volume.
Charts in TabTrader are equipped with different tools for technical analysis: indicators, drawing tools and rulers.
The instrument page is also accessorized with essential live trading information: order book and last trades.
Charts have an interactive interface for applying orders, alerts and shapes right over them.
All your orders, trades and alerts are visually represented on the chart.
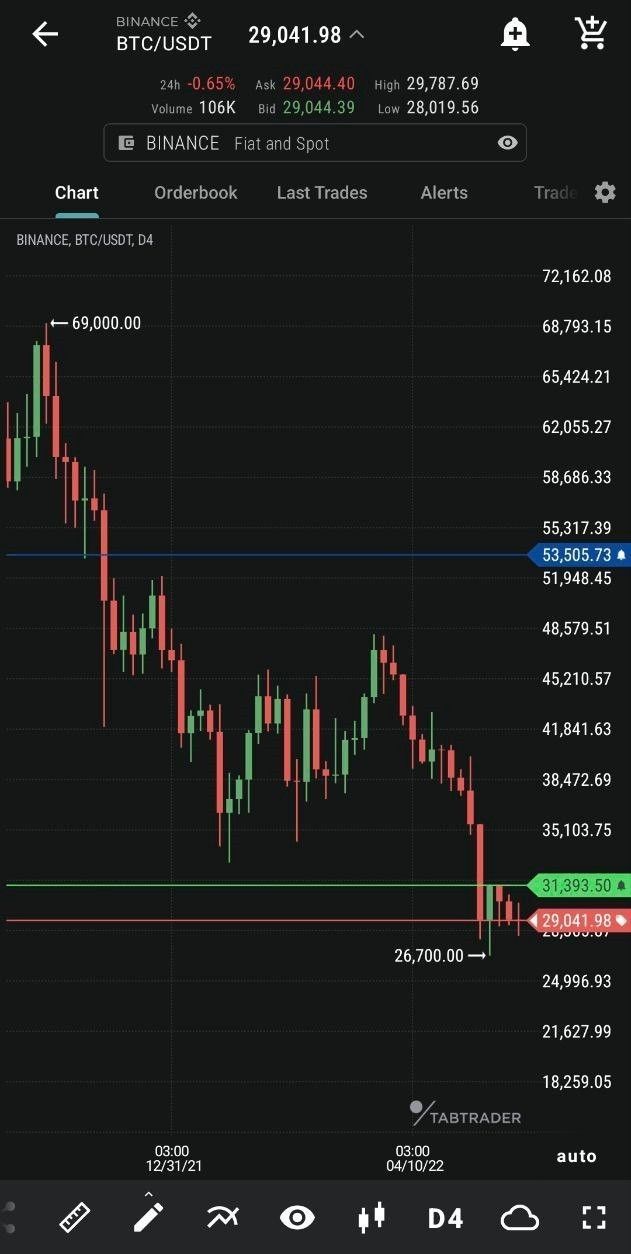
Alert and order on a chart
Dashboard
The Dashboard is located at the top of the chart screen. In the upper left corner sits the name of the exchange and its instrument. Two buttons on the opposite side open the alert and order screens respectively.
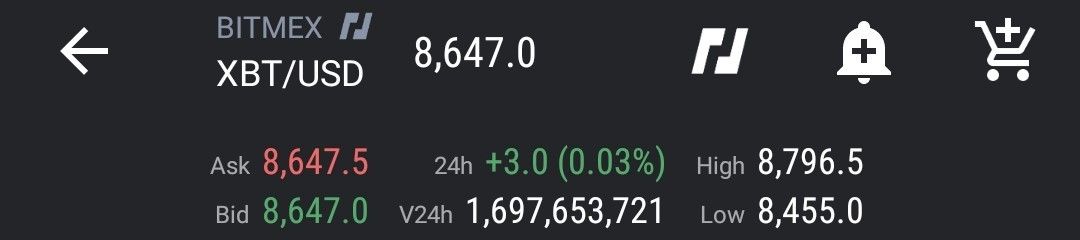
Dashboard view
You can view the instrument’s market price, bid/ ask, 24H percentage change and volume, upper and lower price levels.
Toolbar
The Toolbar is located below the chart and contains the following tools (in order of appearance):
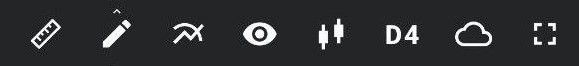
Bottom toolbar
Share chart — share an image of your chart via various messaging services;
Ruler — a tool to measure time, distance, and price on your chart;
Shapes — apply shapes right over the chart to perform your technical analysis; long press to open the list of all drawn shapes;
Indicators — use pattern-based signals to enhance your technical analysis;
Layers (visibility) — a list of objects to be visible or hidden on charts (shapes, alerts, orders, trades, indicators, local min and max prices and countdown timer);
Chart types — a representation of price movement in the form of trend lines, bars, candlesticks, Heikin Ashi candles, etc.;
Timeframes — price movement expressed over a certain period of time;
Configurations — make your own preconfigured sets of layers, timeframes and chart types;
Fullscreen — expand your chart view by hiding the dashboard.


