Commodity Channel Index
The Commodity Channel Index (CCI) is a tool used to analyze whether an asset is overbought or oversold. It measures the difference between the current price and the historical average price. CCI provides insights into the price action of an asset by standardizing its movements. This in turn helps determine whether or not to close a position at a certain price.
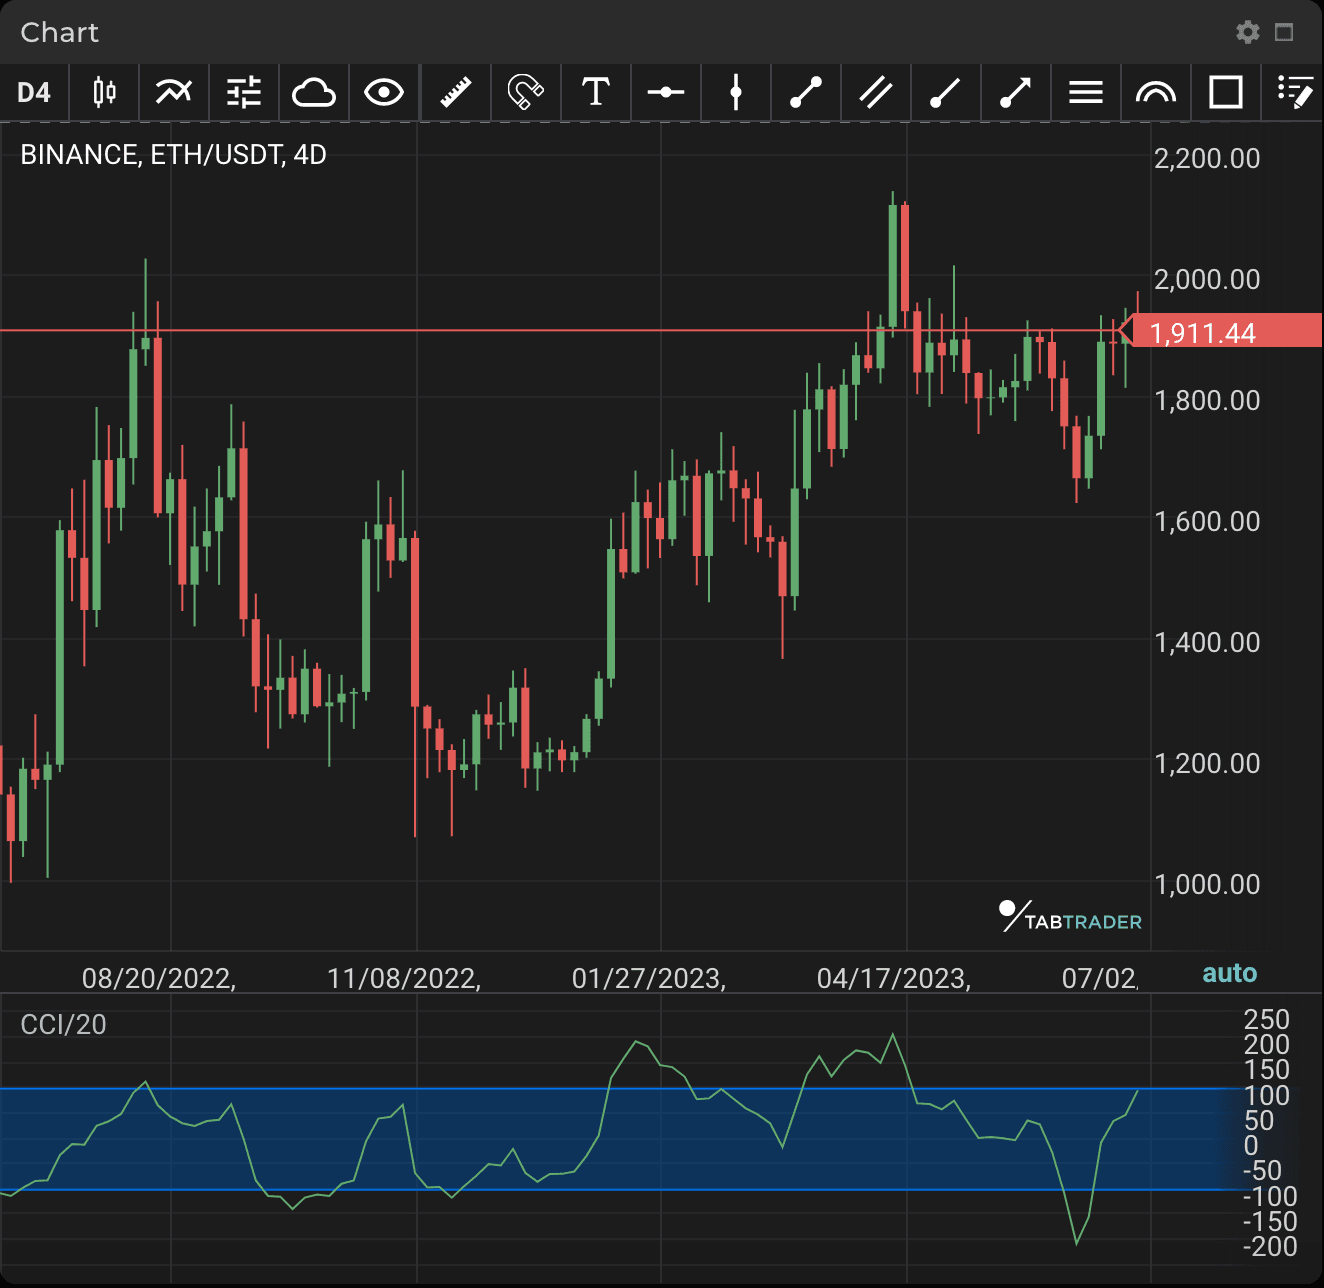
The CCI scale normally varies between -100 and +100. Note that the more volatile an asset is, the more likely a larger scale will be required — for example, -200 to +200. When CCI moves above +100, this typically implies the start of a new bullish trend. When CCI hits -100, it implies the opposite.
It is important to note that since there is technically infinite ground on either side of the points of action, there is no definitive value at which “overbought” or “oversold” can be attributed to an asset.
Since the indicator is free-floating, overbought or oversold levels are not expressed as definite values. For traders it is necessary to observe the indicator’s past readings to understand price reversal levels. The price of one asset may reverse near +200 and -150, while another might be prone to price reversals at +325 and -350.
Divergences between price and the indicator, if price is moving up and CCI is falling, can indicate trend weakness. Divergence is not a reliable trade signal because it can last for a long time without ending up in a price reversal; however, it may alert a trader to secure their position against a potential reversal.
CCI
Calculation
CCI = (Typical Price − MA) / (.015 × Mean Deviation)
Where:
Typical Price (TP) = (High + Low + Close) / 3
Moving Average (MA) = Typical Price / P
P = Number of periods
.015 = constant
Mean Deviation = (Typical Price−MA) / P
To calculate CCI, define how many periods the indicator will analyze (20 is the default number). Fewer periods will make for a more volatile picture, while more periods will make the picture smoother.
Track the high, low, and close for the chosen number of periods and compute the Typical Price.
Then calculate the Moving Average (MA) of Typical Price by summing them and dividing by the number of periods.
Determine the mean deviation by subtracting the MA from the typical price for the number of periods. Add up the absolute values of these figures and then divide by the number of periods.
Insert the most recent typical price, the MA and the mean deviation into the formula above and compute CCI.
The calculation is thereafter applied to each new period in the same way.


