Directional Movement Index
The Directional Movement Index (DMI) is a tool used to identify asset price trends. This indicator can help traders know whether price action is flatter or more volatile.
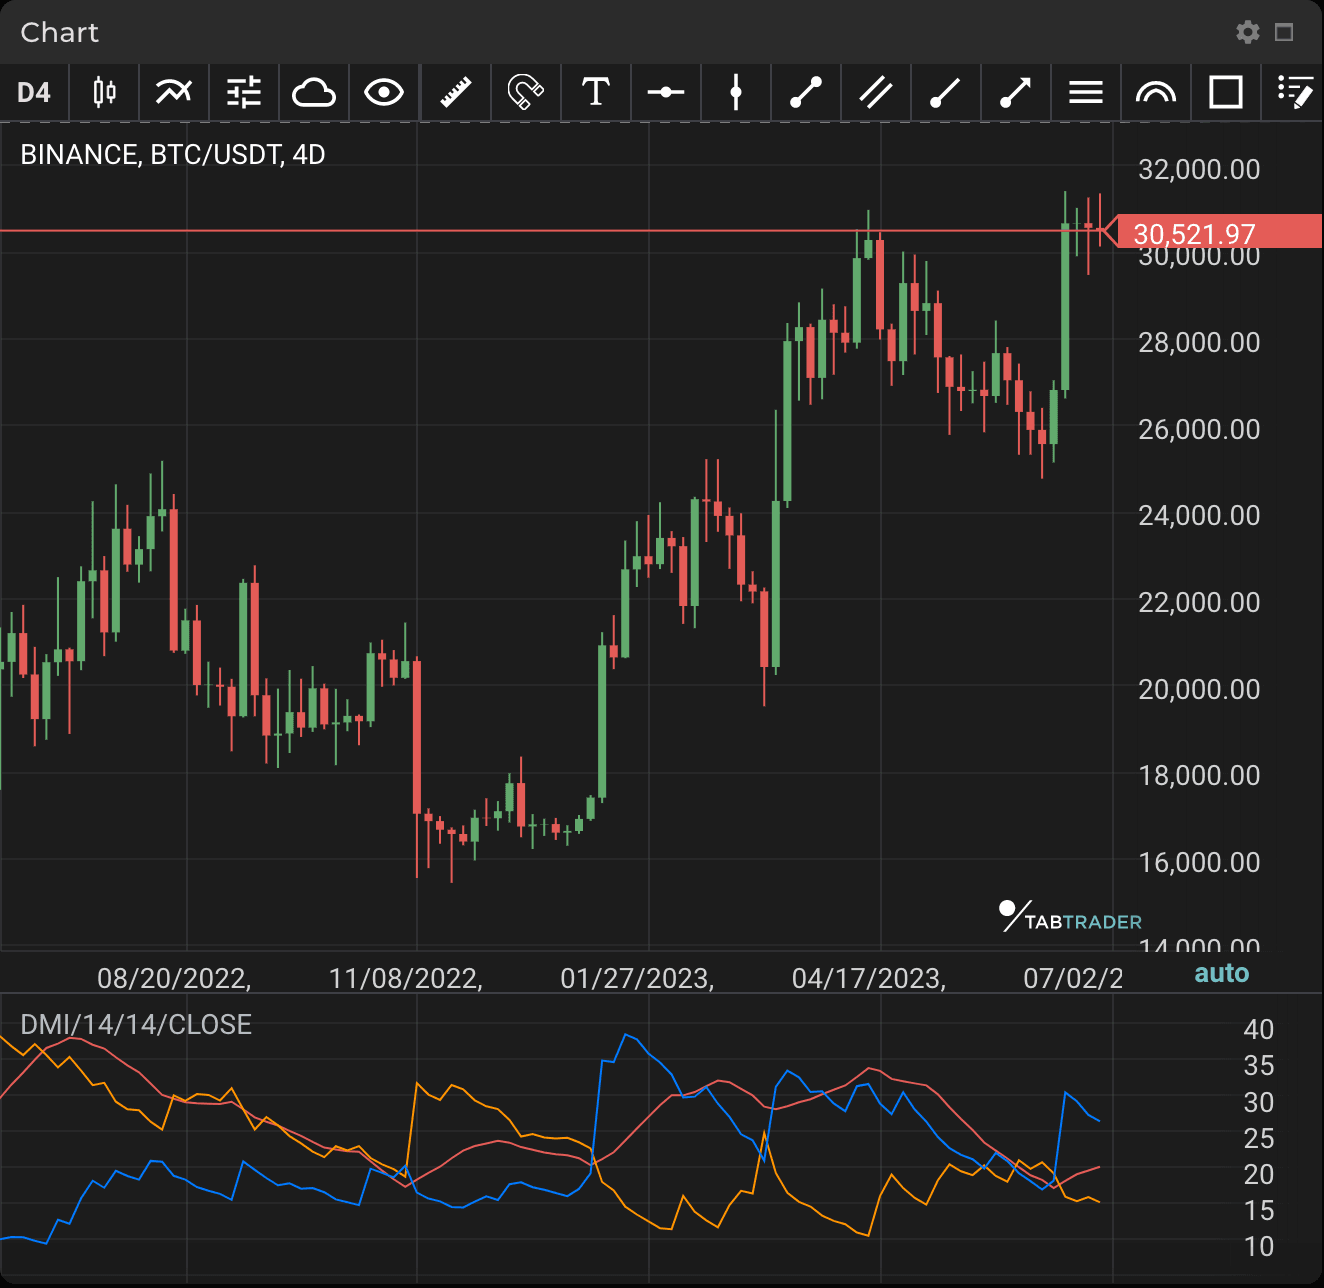
DMI compares historical highs and lows, illustrating them with two lines: a positive directional movement line (+DI) and a negative directional movement line (-DI). An optional third line called the average directional index (ADX) can also be used to gauge the strength of the uptrend or downtrend.
Crossovers are the main trading signals. Generally, traders take a long position when +DI crosses above -DI as an uptrend could be underway. Meanwhile, it is considered a sell signal when +DI instead crosses below -DI. In such cases, a short position is taken because a downtrend might be in progress.
DMI allows a trader to only enter positions when a trend exhibits palpable momentum because it differentiates between strong and weak trends, and it is thus generally useful for trend-based trading strategies.
First of all, traders check which of the two DMI lines is dominant (on top). The dominant DMI is stronger and more likely to predict price direction. To switch sides in dominance, the lines should cross over. However, such DMI crossovers prove unreliable in many cases; depending on volatility, they may give false or delayed signals.
Price strength should also be considered: DMI strength ranges on a scale between 0 to 100. The higher the DMI value, the stronger the price. When the DMI value is over 25, the price is strong. Conversely, when the DMI value is under 25, the price is weak. The greater the separation between the lines, the stronger the volatility. Many short-term traders look for periods in which the DMI lines move away from each other and volatility increases.
DMI
Calculation
+DI = ((Smoothed + DM) / ATR) × 100
-DI = ((Smoothed - DM) / ATR) × 100
Where:
Smoothed +/- DM = DM - (DM / number of periods) + CDM
CDM = Current DM
ATR = Average True Range
To calculate DMI, compute +DM, -DM and the True Range (TR) for each period (normally 14 periods are used).
+DM = current high - previous high. -DM = previous low - current low.
Use +DM when (current high - previous high) is greater than (previous low - current low).
Use -DM when (previous low - current low) is greater than (current high - previous high).
Smooth the 14-period averages of +DM, -DM and the TR. To do so, insert the -DM and +DM values.
First TR = sum of the first TR readings × number of periods.
Next TR value = First TR - (Prior TR × number of periods / number of periods) + Current TR.
Then divide the smoothed +DM value by the Smoothed Average True Range (ATR) value to get +DI. Multiply by 100.
Divide the smoothed -DM value by the smoothed TR value to get -DI. Multiply by 100.
The optional directional index (DX) = (+DI) - (-DI) / (+DI) + (-DI). Use absolute values. Multiply by 100.
The Average Directional Movement Index (ADX) is a smoothed average of DX.
To get ADX, continue to calculate DX values for at least 14 periods. Then smooth the results to get ADX.


