Fisher Transform
Fisher Transform (FT) is a technical indicator that converts price to normal (also known as Gaussian) distribution and signals when price action moves significantly by referencing recent price data. Information provided by FT can help identify reversals or major changes in asset prices.
Ultimately, this indicator can be used to determine trends and highlight key price moves within those trends.
The core of FT is the Fisher Line, revealing transformed price values and deviations from the market mean. The Trigger Line dynamically responds to shifts in market sentiment, while strategically placed Signal Levels provide quantifiable markers for the intensity of these shifts.
Many traders opt to use FT with other indicators that specifically cater to trend analysis. This is because FT sends out many different trading signals, some of which are not at all profitable. By pairing it with other indicators, traders get a more complete picture on when to acknowledge and act on buy and sell signals.
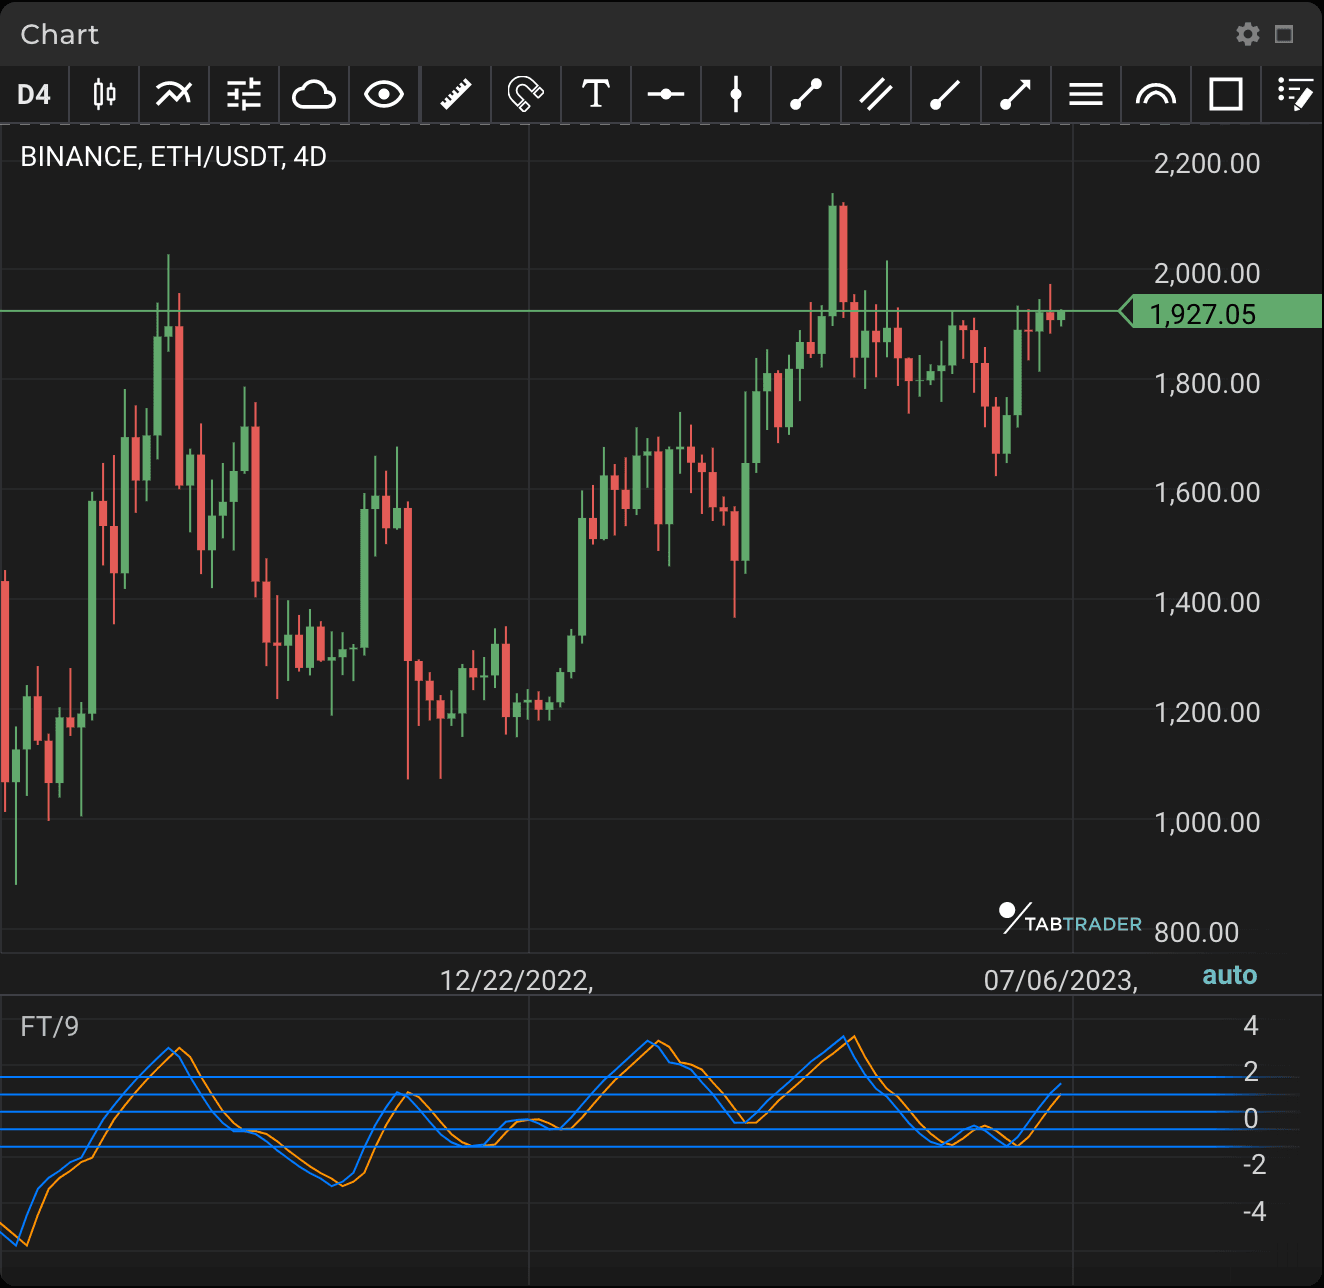
FT
Calculation
The following steps include combining high and low prices, determining maximum and minimum values over a specified look-back period, and normalizing the price range. The subsequent Fisher Transform calculation then produces smoothed values that aid in recognizing potential turning points in market trends.
High-Low Calculation:
Combine the high and low prices for each period to get HL_t representing the price range.
Calculate HL_t by adding the high and low prices at time t:
HL_t = 2 * max_t
Maximum and Minimum Calculation:
Find the maximum (max_t) and minimum (min_t) values of HL over the look-back period (n):
max_t = max(HL_{t-1}, ..., HL_{t-n+1})
min_t = min(HL_{t-1}, ..., HL_{t-n+1})
Normalized Value Calculation:
Calculate a normalized value (val_t) that adjusts for the range of prices and builds on the previous normalized value:
val_t = 0.332 * ((HL_t - min_t) / max_t - 0.5) + 0.67 * val_{t-1}
Fisher Transform Calculation:
Use val_t to calculate the Fisher Transform value (Fisher_t):
Fisher_t = 0.5 * log((1 + val_t) / (1 - val_t))
Fisher Signal Calculation:
Determine the Fisher Signal, representing the change in the Fisher Transform value from the previous period:
Fisher Signal = Fisher_t - Fisher_{t-1}


