Parabolic SAR
The Parabolic SAR (Parabolic Stop and Reverse) is a technical indicator used to determine the price direction of an asset, as well as draw attention to when the price direction is changing. It is sometimes known as the "stop and reversal system”.
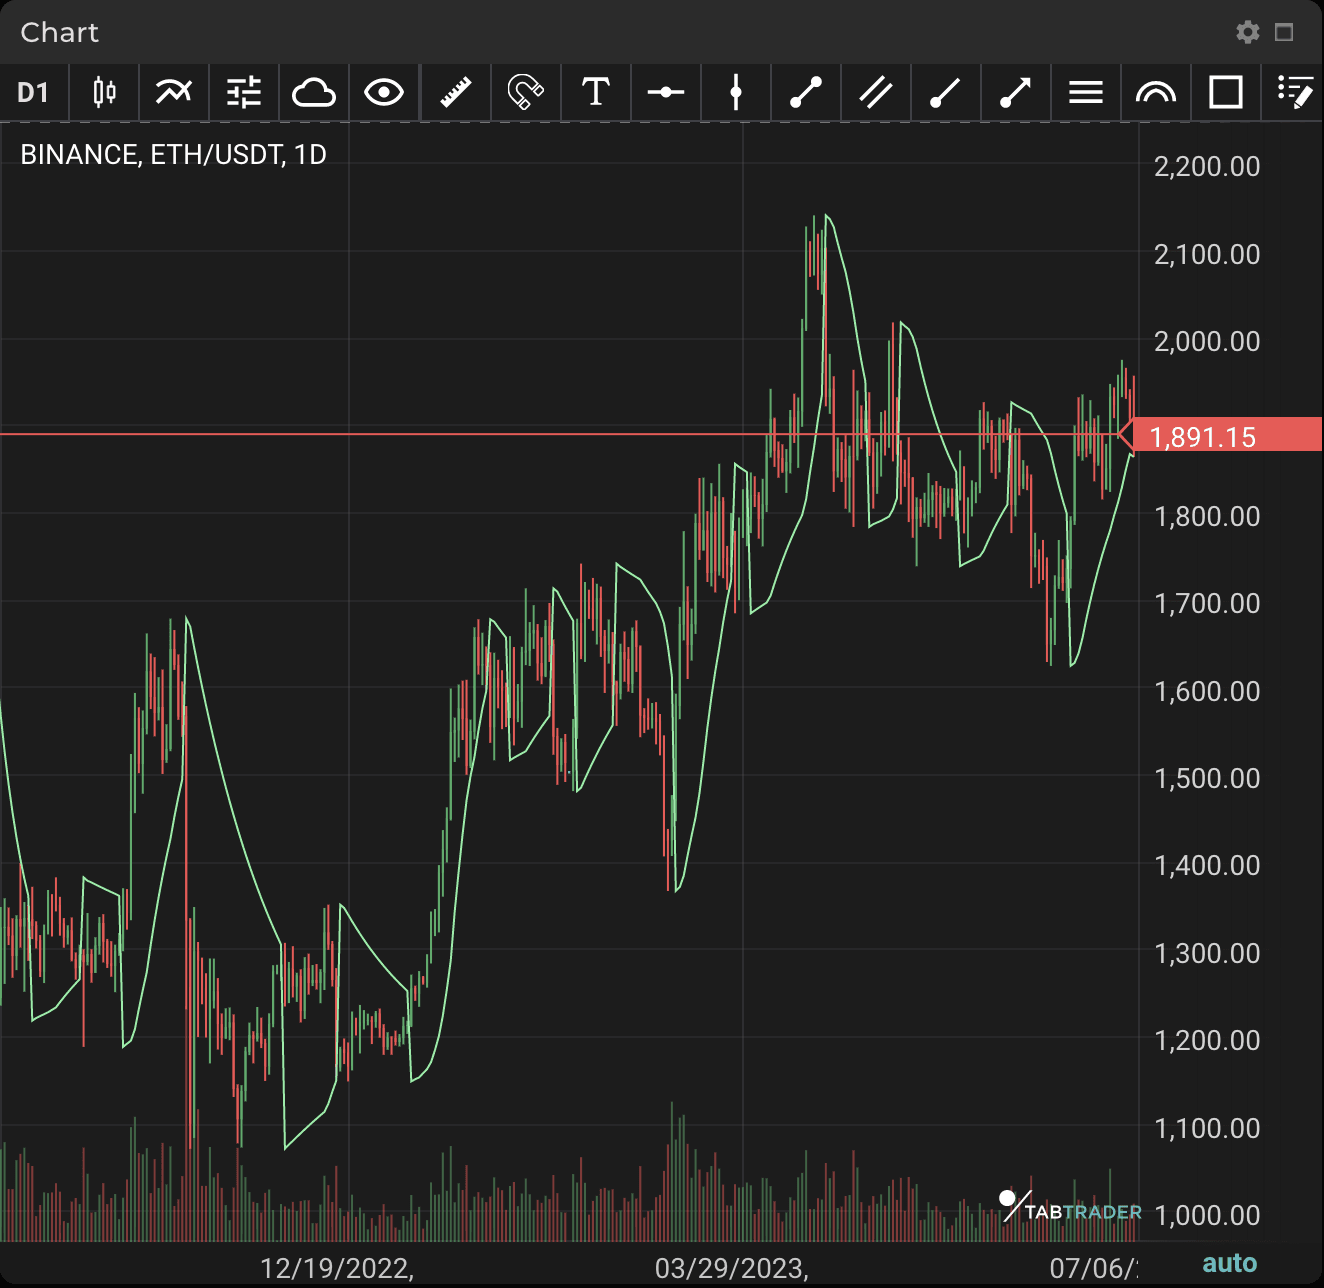
On a chart, the indicator appears as a series of dots placed either above or below the price bars. A dot below the price is deemed to be a bullish signal. Conversely, a dot above the price is used to illustrate that the bears are in control and that momentum is likely to remain downward. When the dots flip, it indicates that a potential change in price direction is underway. For example, if the dots are above price, when they flip below it, it could signal a further price increase.
The parabolic SAR is also a method for setting stop-loss orders. When an asset is rising, move the stop-loss to match the parabolic SAR indicator. The same concept applies to a short trade — as price falls, so will the indicator.
The parabolic SAR indicator is used by traders to determine trend direction and potential reversals in price.
PSAR
Calculation
RPSAR=Prior PSAR+[Prior AF(Prior EP-Prior PSAR)]
FPSAR=Prior PSAR−[Prior AF(Prior PSAR-Prior EP)]
Where:
RPSAR = rising PSAR
AF = Acceleration Factor
(This starts at 0.02 and increases by 0.02 up to a maximum of 0.2; each time the extreme point makes a new low (falling PSAR) or high (rising PSAR))
FPSAR = falling PSAR
EP = Extreme Point (the lowest low in the current downtrend (falling PSAR) or the highest high in the current uptrend (rising PSAR))
- If the PSAR is initially going up while price falls below the rising PSAR value, the trend is now down and the falling PSAR formula is to be used.
- If price rises over the falling PSAR value, it switches to a rising PSAR.


