Relative Strength Index
The Relative Strength Index (RSI) is a momentum indicator used in technical analysis that measures the magnitude of recent price changes to evaluate overbought or oversold conditions in the price of a stock or other asset. RSI is displayed as an oscillator (a line graph that moves between two extremes) and gives a reading from 0 to 100.
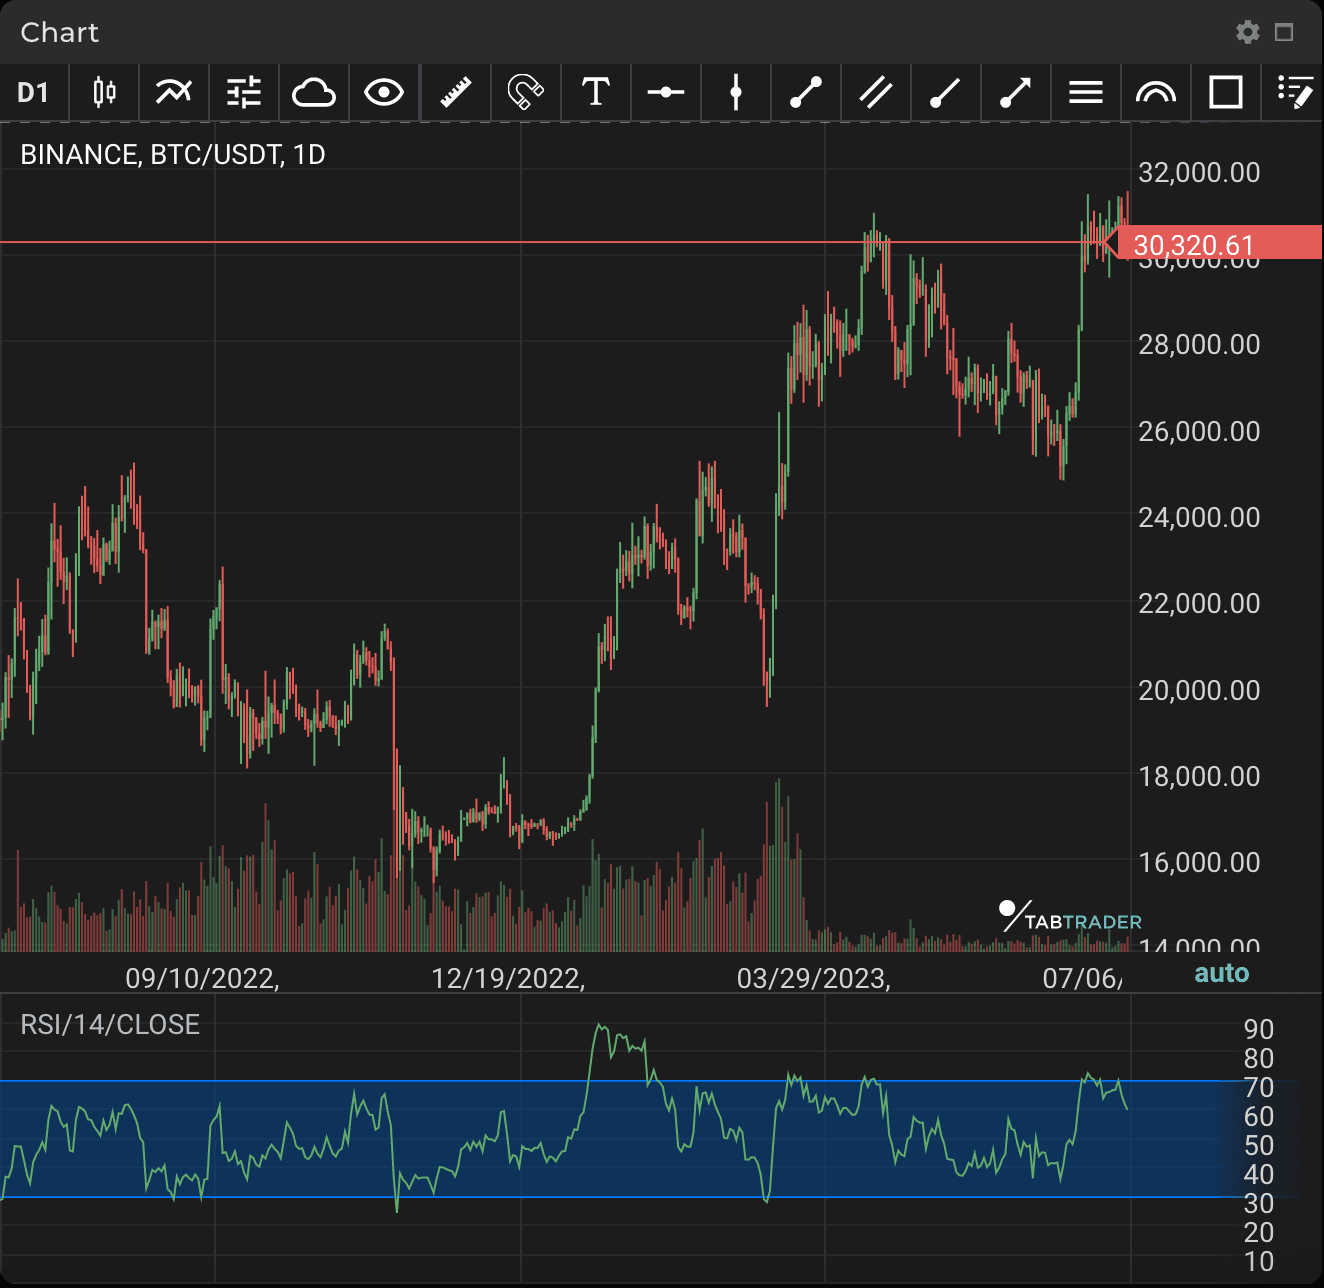
The traditional interpretation of RSI states that values of 70 or above indicate an asset is becoming overbought or overvalued and may be primed for a trend reversal or corrective pullback in price. An RSI reading of 30 or below conversely indicates oversold or undervalued conditions.
RSI
Calculation
RSI = [100 - (100/{1+ RS})]
Where:
Relative strength (RS) = (Avg Gain)/(Avg Loss)
To smooth price movement, it is most practical to use an average of gains and losses for a set period.
By default period length is set to 14.
In the default setup, the first 14 periods present a simple average of the values. If we add the previous period’s average gain to the current gain, the formula will be as follows:
[(Previous avg. gain)*13)+ current gain)]/14
Calculation of average loss is done the same way.


