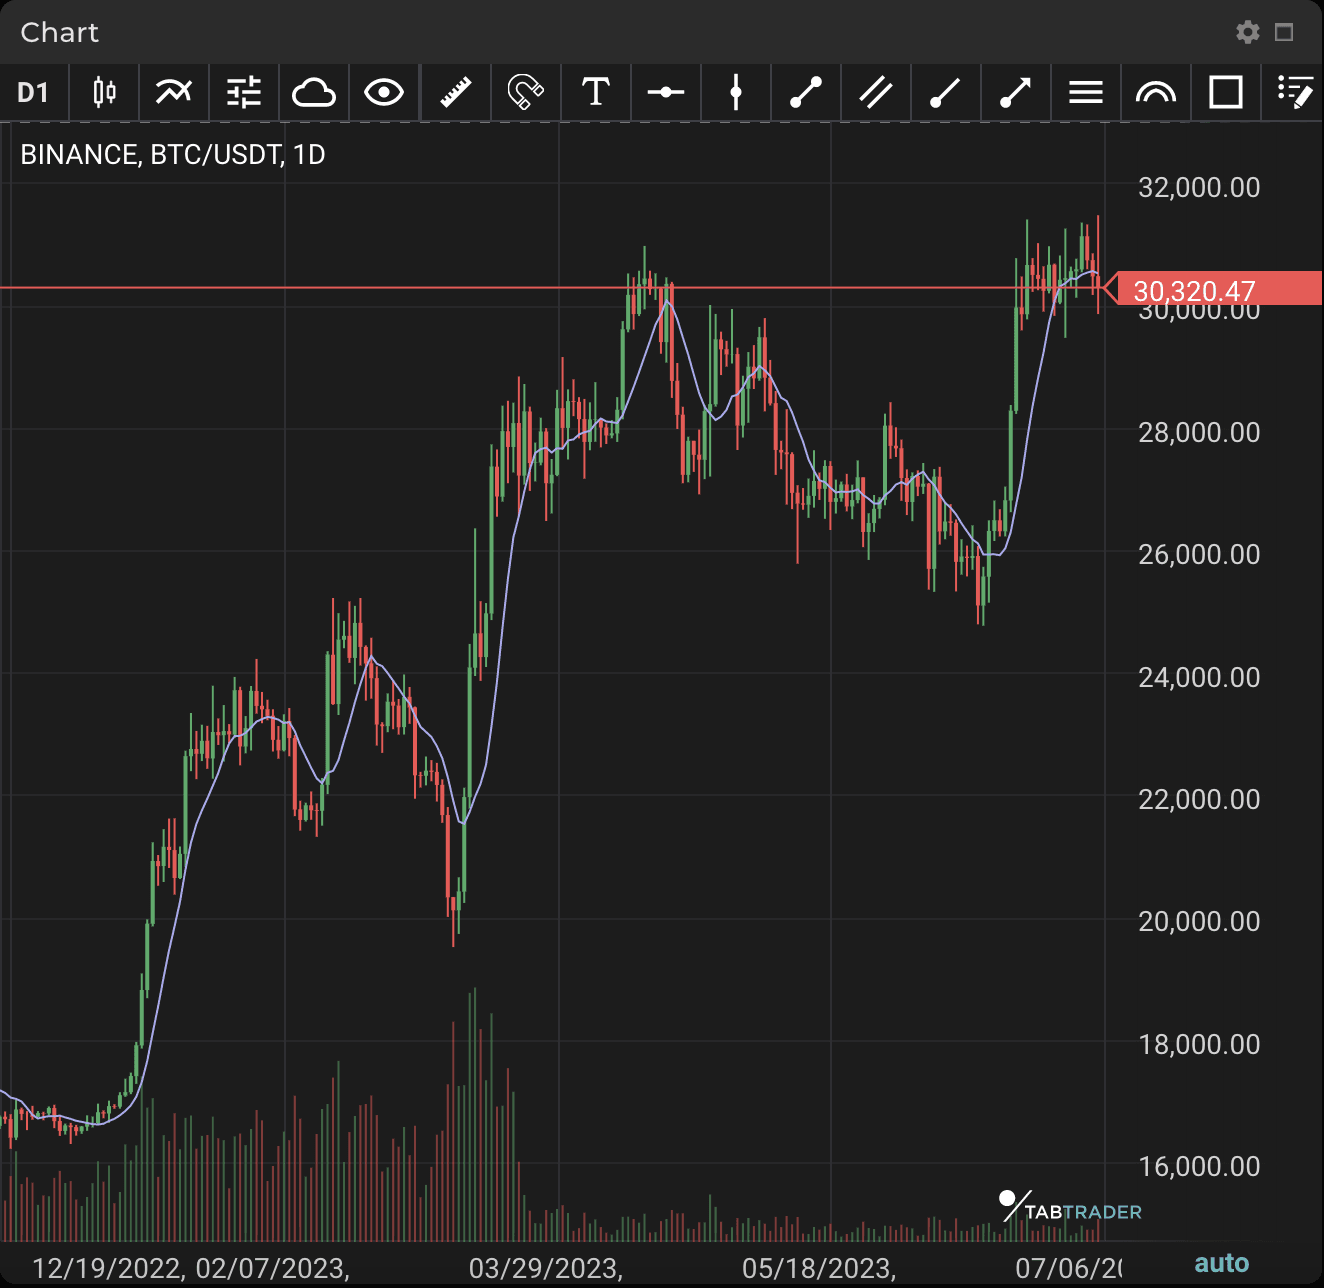
Simple Moving Average
A Simple Moving Average (SMA) calculates the average of a selected range of prices, usually closing prices, using the number of periods in that range.
SMA is an arithmetic moving average calculated by adding recent prices and then dividing that figure by the number of time periods in the calculation range. For example, one could add up the closing prices of an asset for a number of periods and then divide the total by that same number of periods. Short-term averages respond quickly to changes in the price of the underlying asset, while long-term averages are slower to react.
Two popular trading patterns that use SMAs include the death cross and golden cross. A death cross occurs when the 50-period SMA crosses below the 200-period SMA. This is considered a bearish signal, indicating that further losses are in store. The golden cross occurs when the short-term SMA breaks above the long-term SMA. Reinforced by high trading volumes, this can signal further gains are to come.

SMA
Calculation
SMA=(A1+A2+…+An)/n
Where:
An = the price of an asset at period n
n = the number of total periods
An SMA can be adjusted for different numbers of time periods. This is done by adding the closing price (customizable to use high, low or open) of the asset for a number of time periods and then dividing this total by the number of time periods. This gives the average price of the asset over the time period.


