Fisher Transform
Fisher Transform (FT) is a technical indicator that converts price to normal (also known as Gaussian) distribution and signals when price action moves significantly by referencing recent price data. Information provided by FT can help identify reversals or major changes in asset prices. Ultimately, this indicator can be used to determine trends and highlight key price moves within those trends.
What it does
This technical indicator is what some would call “unbounded” and therefore it is possible for extremes to occur in the long term. The basis of what constitutes an “extreme” is determined by the historical readings of the asset in question. Reading values differs depending on the specific asset. Asset readings are important because they have the potential to signal a reversal, which can be confirmed or rejected by FT directional changes.
FT will often have a signal line attached. This is essentially FT’s moving average and moves slower than the traditional indicator line. It is often used when FT moves across the trigger line.
Many traders opt to use FT with other indicators that specifically cater to trend analysis. This is because FT sends out many different trading signals, some of which are not at all profitable. By pairing it with other indicators, traders get a more complete picture on when to acknowledge and act on buy and sell signals.
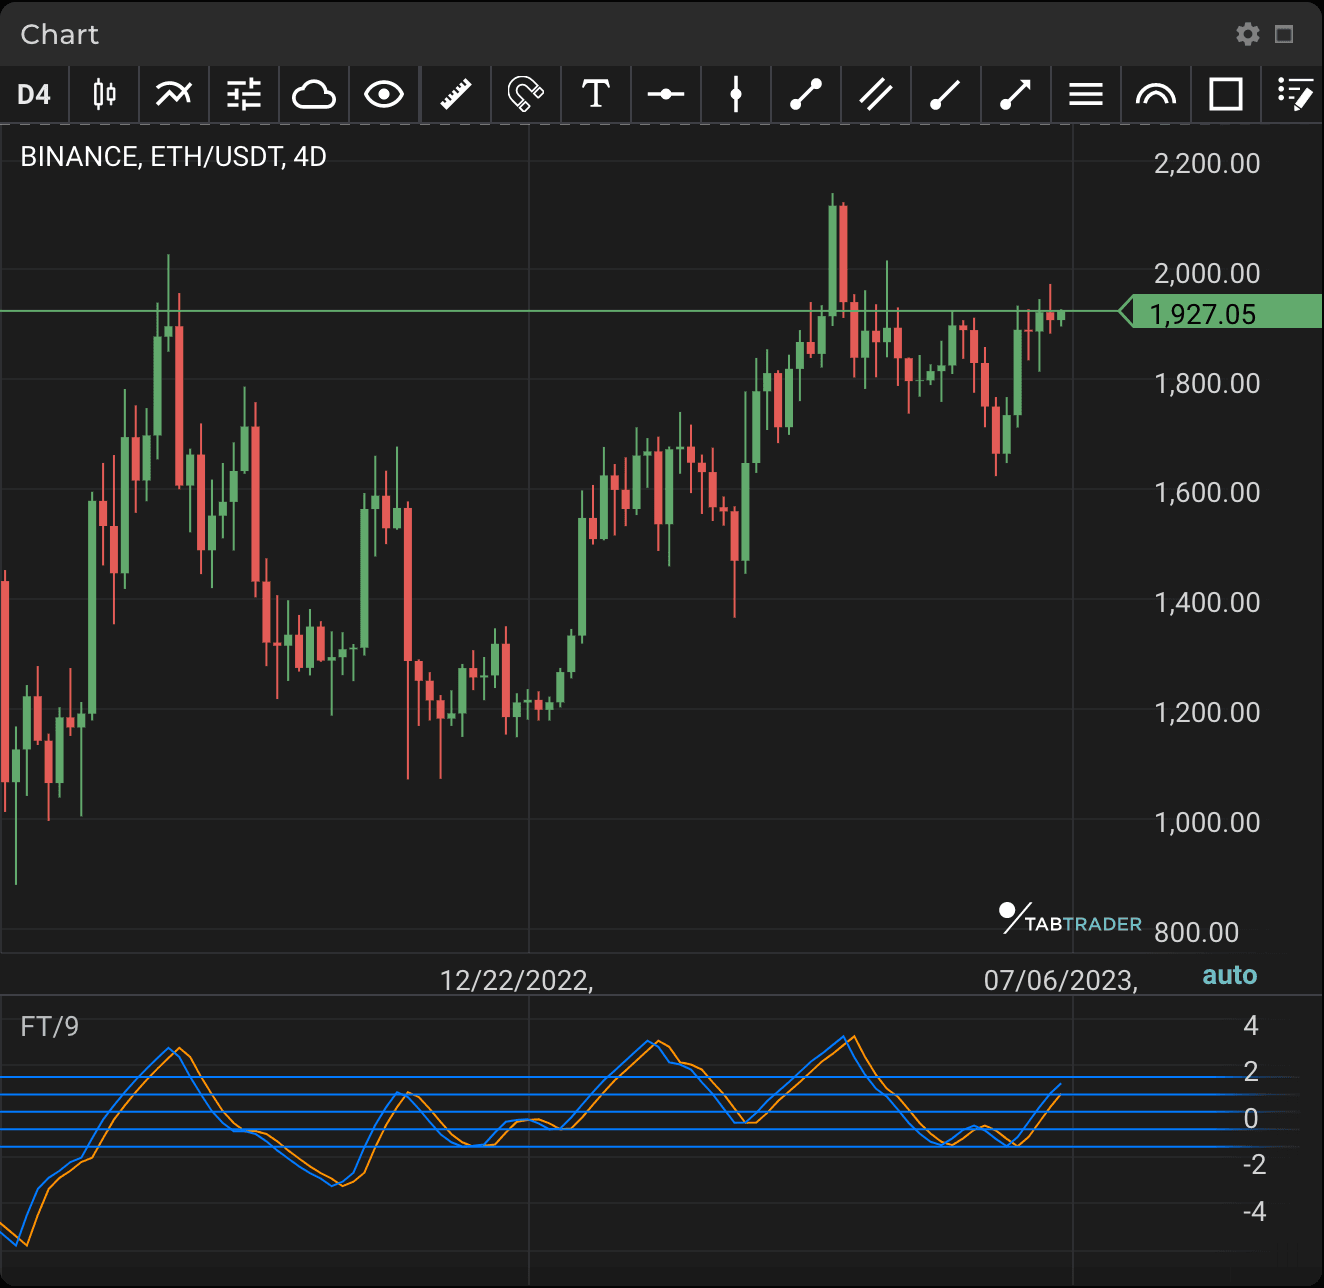
FT
Calculation
The formula for FT is as follows:
Fisher Transform = ½ * ln(1 + X / 1 - X)
Definition:
ln= natural logarithm
X= the transformation of price from -1 to +1
- To calculate FT, first choose the retrospective period to examine (eg. 9 periods). This will be the number of periods the indicator will be applied to.
- Once you have selected a period, convert the prices of the period to values between -1 and +1. Don’t forget to input for X and perform all calculations within the bracketed part of the formula.
- Multiply the results by the natural log.
- With this new result, multiply by 0.5.
- Repeat the calculation process as each period concludes and convert the most recent price to a value between -1 and +1 (based on the most recent periods).
- To finish, add/ subtract the calculated values from the previous calculated value.


