How to identify Bitcoin Support and Resistance Levels
Imagine a crypto price like an elevator moving through a half-built skyscraper. It climbs smoothly for a while, then runs into a ceiling. It bumps into that same spot a couple of times, testing the structure.
If it finally pushes through, that old ceiling becomes the new floor. Traders now treat it as solid ground. A level where buyers step in, regroup, and look for the next move upward.
If the elevator doesn’t have enough strength to break through, it drops back down to the previous floor. Simple concept, but the market repeats this dance endlessly.
Many new traders make mistakes here. They open a chart and draw too many lines, making it messy. This makes it easy to miss important signals and get frustrated when trades fail.
The real fix isn’t adding more lines. Support and resistance aren’t decorations. They’re reflections of supply, demand, and the collective decisions of buyers and sellers. Once you start seeing them this way, the chart stops looking chaotic and starts making sense.
Key takeaways
To find support and resistance levels on a chart, traders focus on these:
- Start with horizontal zones: Identify major "swing highs" and "swing lows" on weekly or monthly charts. Draw these as rectangular zones rather than thin lines to account for volatility.
- Use dynamic Indicators: Add the 50-Day and 200-Day EMAs (or the 20-week SMA) to spot moving support levels that trend with the price.
- Check the volume profile (VPVR): Look for "High Volume Nodes" on the histogram; these are price levels where heavy trading has occurred, acting as natural barriers.
- Mark psychological numbers: Watch for reactions at clean, round numbers (e.g., $100,000) where retail and institutional orders tend to cluster.
- Apply Fibonacci Retracements: In a trend, measure the move to find the 0.618 "Golden Pocket," a common reversal zone for crypto assets.
What creates a level?
Before drawing anything on a chart, it helps to understand why the price tends to stall in certain areas. It’s just a mix of human behavior and pending orders waiting to be triggered. Knowing this helps answer the question, What is a resistance and support zone in crypto?
1. Resistance zone
Resistance forms where selling outweighs buying. Think of it as a crowd of sellers stacked at the same doorway. For example, when Bitcoin rallies into a zone like $90,000 and suddenly stops climbing, several things are usually happening at once:
- Profit-taking: Traders who rode the move from lower levels decide this is a good time to cash out.
- Trapped buyers exiting: People who bought at $90,000 months ago finally see breakeven and quietly hit the sell button, happy to get out alive.
- Short sellers stepping in: Bears look at the price and decide it’s rich enough to start leaning on it.
That combined wave of selling pressure forms a ceiling.
2. Support zone
Support is the opposite dynamic. It is a crowd of buyers waiting below the market. When price flushes toward $60,000 and immediately bounces, it’s usually because:
- Value buyers: Larger players see a discount and start loading up.
- Short covering: Traders who shorted the move down begin locking in profits.
- Late entrants: Some traders treat the dip as their chance to finally join the trend.
Together, this horizontal support resistance creates a floor strong enough to halt the drop.
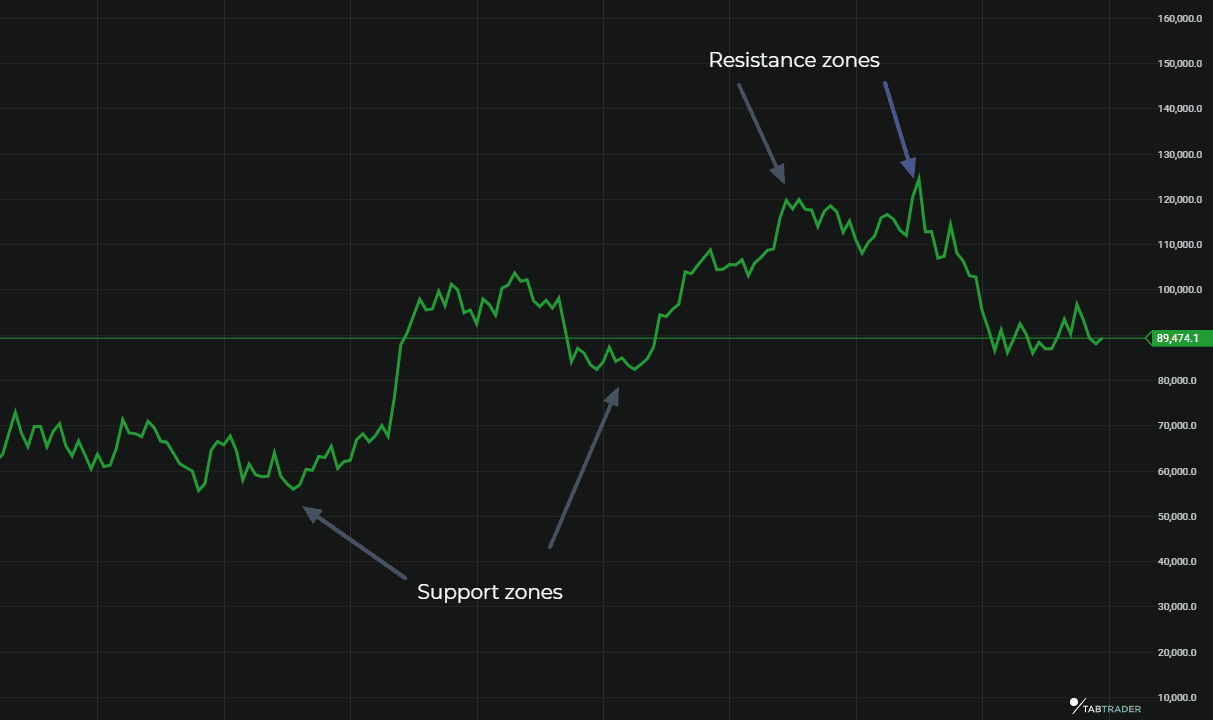
Resistance and Support zones.
How to identify Bitcoin support and resistance levels
Method 1: Static liquidity (Horizontal levels)
Static levels are the foundation of price analysis. These are fixed prices, floors, and ceilings that don’t change over time.
Swing highs and swing lows
The cleanest horizontal levels come from obvious turning points:
- A swing high forms when price pushes upward, hesitates, and rolls over.
- A swing low forms when price sells off, finds its footing, and turns back up.
A quick note from experience: avoid starting on tiny timeframes. The lower you go, the more meaningless noise you’ll draw.
Begin on the Weekly or Monthly chart, mark the major structural levels, and only then drop down to the 4H or 1H to fine-tune entries. The big players work this way, and it saves you a lot of headaches.
Body vs. Wick debate
Traders often get hung up on whether to draw a line at the candle’s body close or the wick tip. In practice, a single thin line rarely captures how the market behaves.
A better approach is to use zones:
- Wick shows the extreme. Panic, euphoria, or a one-off stop-hunt.
- The Body shows where the market actually agreed on price.
Professionals wrap the whole thing into a rectangle. Markets rarely pivot on an exact number. Bitcoin doesn’t politely turn at $69,420.00. It usually pivots somewhere inside a range like $69,000 to $69,500. Using zones keeps you from getting clipped by a stray wick.
The S/R flip (Role reversal)
One of the most reliable behaviors in trading is the moment resistance breaks and turns into support. It’s a clean shift in control. Picture bulls finally breaking through a defended price. Once they’re through, they reinforce that area on the retest. What was once a wall becomes a floor.
An example: $69,000. It capped price in 2021, sat untouched for years, and became the new base after Bitcoin broke above it in 2024. When the price returned to that level, it held exactly what a successful S/R flip looks like.
Method 2: Dynamic support (Moving averages)
Horizontal levels are helpful, but the market doesn’t always behave in straight lines. Sometimes the “floor” moves with the trend, rising or falling over time.
These moving averages act like an adjustable support beam: steady, but always shifting. As long as the trend stays intact, price often returns to these lines, taps them, and continues in the same direction.
Key indicators to watch
20-week SMA (Bull Market Support Band) Long-term investors treat this like a health check. In a strong bull market, Bitcoin often tags the 20-week SMA during corrections and then recovers. Losing it for good has historically marked the start of deeper downturns.
50-Day & 200-Day EMA The classic pair. Traders watch these constantly:
- Golden Cross: 50-Day moves above the 200-Day. A sign momentum is shifting upward.
- Death Cross: 50-Day drops below the 200-Day, usually a warning that things are deteriorating.
Big desks and automated systems tend to respond when price tests the 200-Day EMA during trends, which is why this line gets defended so often.
Bollinger Bands when the market is drifting sideways and volatility squeezes, the lower band often catches dips and the upper band caps rallies. It’s not perfect, but it adds context to a lazy, ranging market.
Method 3: Volume-based levels (The “Real” Support)
Most traders stare at candles. More experienced traders focus on where actual trading takes place. Volume Profile gives you that information.
Volume Profile Visible Range (VPVR)
Unlike standard volume bars at the bottom of a chart, VPVR shows how much trading occurred at each price level, not each day. You’ll see a horizontal histogram on the right side of your chart.
It helps you identify three structures:
1. High volume nodes (HVN)
These are the thick hills on the histogram. Points where there was a lot of back-and-forth.
- Meaning: The market sees these levels as fair value.
- Behavior: Price moves slowly through them. They act like mud, slowing everything down.
- Function: Strong support/resistance due to the sheer amount of participation.
2. Low volume nodes (LVN)
These are the gaps or valleys.
- Meaning: Price barely spent time here.
- Behavior: When price enters an LVN, it tends to move quickly.
- Function: These are fast-track zones. Little friction, little resistance, and often sharp moves to the next HVN.
3. Point of control (POC)
The largest bar on the histogram. This is the price level with the most total volume traded. The POC acts like a magnet. When price drifts too far away, it often gets pulled back toward this level.
Method 4: Psychological levels
Round numbers shouldn’t matter, but they do. Humans like clean milestones, and markets reflect that.
The power of zeros
Bitcoin tends to react around obvious prices: $10k, $50k, $100k. These zones attract heavy attention:
- Retail traders cluster orders there simply because the numbers feel neat.
- The institution's anchor option strikes around them.
- Headlines and social sentiment flare up at these levels.
This creates predictable pressure and behavior.
The “front-run” effect
Because huge round numbers often act as resistance or support, smarter traders place their orders near the level instead of on it. So instead of waiting for $100,000, they’ll place sells at $99,900, $99,800, and so on. This chain reaction can cause reversals slightly before the round number is touched.
Same logic for buying: avoid sticking buy orders exactly on $50,000. A little offset keeps you ahead of the crowd.
Method 5: Fibonacci Retracement
If horizontal lines are the floor and ceiling, Fibonacci levels are the measuring tape. They help answer the most common question in a trending market: "The price is pulling back, but how deep will it go before it bounces?"
These levels are based on a mathematical sequence found in nature, but in trading, they work for a simpler reason: Self-fulfilling prophecy. Because thousands of bots, algorithms, and human traders are watching these specific lines, the market tends to react to them.
How to draw it correctly Many beginners draw Fibs randomly. To get it right, you need to measure a complete move:
- In an Uptrend: Click the tool on the absolute Swing Low (where the move started) and drag it to the Swing High (where the move paused).
- In a Downtrend: Connect the High to the Low.
This projects a set of horizontal lines that act as potential support zones.
The Levels that actually matter Your software will show you a dozen lines. You only need to focus on a few key areas where crypto tends to react:
- The "golden Pocket" (0.618 – 0.65): This is the holy grail for retracement traders. The 61.8% level is mathematically significant, but in crypto, price often wicks slightly below it. If Bitcoin rallies and then drops back down to this level, traders view this as a prime "discount" zone to re-enter the trend.
- The 50% Retracement (0.5): Technically not a Fibonacci number, but it is a major psychological marker. If an asset gives back exactly half of its gains, buyers often step in to defend the midpoint (equilibrium).
- The Shallow Retracement (0.382): In extremely strong, parabolic trends, price rarely dips all the way to the Golden Pocket. It might only tap the 0.382 level before blasting off again. If you see price bouncing here, it signals aggressive buying pressure.
Trading strategies: Putting it all together
Once you understand how these levels form, the next step is using them in real trades. The following methods are the ones traders rely on most, and they all work off the same idea: respect the levels, but don’t treat any single one as gospel.
1. The confluence strategy
Relying on one level alone is risky. The stronger play is stacking signals until they all point to the same general area. That overlap, confluence, is where trades get interesting.
Example of a high-probability zone:
- Static: A previous swing high sits at $65,000.
- Dynamic: The 200-day EMA is hovering right near $65,100.
- Volume: VPVR shows an HVN around $64,900.
- Psychological: $65,000 is a tidy round number traders like to crowd around.
When four different tools all highlight the same neighborhood, odds are good that price reacts there. Maybe not perfectly, but enough to build a reasonable plan around it.
2. Range trading
Markets drift sideways far more often than people expect. When price is stuck between two well-defined levels, you’re basically looking at a trading box.
The approach is simple and surprisingly effective:
- Mark your resistance up top and support down below.
- Long the support zone with a limit order.
- Short the resistance zone with a limit order.
- Keep the stop just outside the range. You don’t want to be the liquidity snack.
- Take profits somewhere in the middle of the range. Traders who shoot for the extremes tend to get punished.
It’s not glamorous, but it works because you’re letting the market come to you instead of chasing candles.
3. Breakout and retest
Breakouts attract beginners like moths to a flame. They buy the second price pokes above resistance, get caught in a fake-out, and watch the chart drift right back under them.
Here’s a calmer approach to consider:
- Let price break the ceiling. No action yet.
- Give it space to run. Let the breakout breathe.
- Wait for the pullback to the old resistance.
- Look for a sign of strength on that retest. It could be a hammer, a small doji, or even just a steady rejection wick.
- Enter there, not during the initial blast.
You now have confirmation that the ceiling has turned into a floor, along with a clean stop level tucked just below it. It’s a quieter trade, but it cuts out most of the noise and keeps you away from the emotional FOMO entries that never age well.
Bottom line
Support and resistance are some of the most reliable tools you have, but they’re still just guides. Markets don’t follow our drawings; they follow order flow. Think of these levels less like steel beams and more like reinforced glass. They are strong most of the time, but they’ll give way if enough pressure builds.
Work with zones instead of razor-thin lines. Stack signals until you see real confluence. And treat the market’s “memory” with respect; it matters far more than people expect.
One last reminder: trade the chart, not the story in your head. Maybe you believe $90,000 should hold. If price slices through it and closes below, that settles it. Your opinion steps aside. The market always gets the final word. Set your stops, honor what the levels are telling you, and keep your ego out of the way.
Important Note: TabTrader does not provide investment, tax, or legal advice, and you are solely responsible for determining whether any financial transaction strategy or related transaction is appropriate for you based on your personal investment objectives, economic circumstances, and risk tolerance. Tab Trader may provide information that includes but is not limited to blog posts, articles, podcasts, tutorials, and videos. The information contained therein does not constitute investment advice, financial advice, trading advice, or any other sort of advice, and you should not treat any of the content as such. TabTrader does not recommend that any digital asset should be bought, earned, sold, lent out, or held by you, and will not be held responsible for the decisions you make.