Introduction to Charts
A chart is a graphical representation of price movement that can be created via the use of various components such as trend lines, candlesticks, bars, Heikin Ashi candles and more.
Charts help you ascertain key information on market price, upper and lower price levels, bid/ ask, 24H percentage change and volume.
How to work with charts
Use touch gestures for scrolling and scaling:
Scroll left/ right to navigate through the chart history
Zoom in/ out – pinch in or stretch out with two fingers over the chart
Vertical scaling – press and hold the price scale and move your finger up and down
Zoom in/out gesture
Vertical scaling gesture
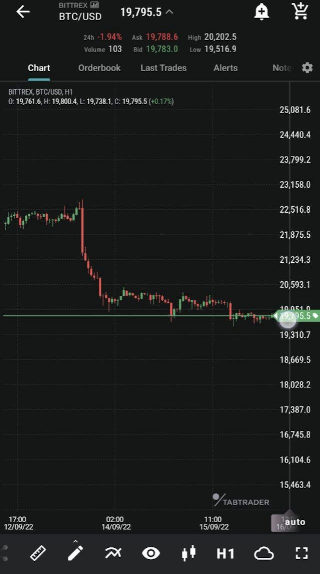
There are two modes for manipulating the chart view: free and auto.
Auto mode is enabled by default, so the chart peaks fit within the screen view.
Free mode enables you to position the screen view of the chart as preferred.
Press “auto” in the lower right corner to enable free mode or to resume auto viewing of your chart.
Expand the view on the chart by means of the full screen button on the toolbar:

Expand icon
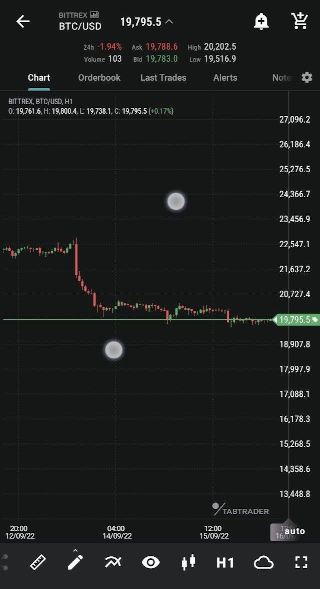
Tap on any candlestick to receive information on it — its historical data will appear in the left upper corner.
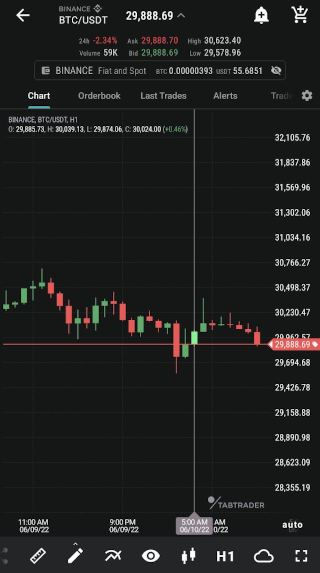
Chart view
Toolbar
Try out the following items of the toolbar at the bottom of the chart:
Share chart — share an image of your chart via various messaging services;
Configurations — make your own preconfigured sets of layers, timeframes and chart types;
Indicators — use pattern-based signals to enhance your technical analysis;
Ruler — a tool to measure time, distance, and price on your chart;
Shapes — apply shapes right over the chart to perform your technical analysis;
Layers (visibility) — a list of objects to be visible or hidden on charts (shapes, alerts, orders, trades, indicators, local min and max prices and countdown timer);
Chart types — a representation of price movement in the form of trend lines, bars, candlesticks, Heikin Ashi candles, etc.;
Timeframes — price movement expressed over a certain period of time.
Interacting with charts
Charts in TabTrader are interactive, allowing you to manually install alerts, place orders, and draw shapes using the crosshair cursor.
Press and hold the chart to open the menu with available items.
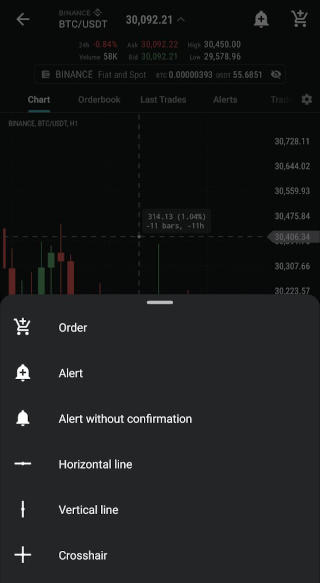
Dialog window
Apply any of the suggested items to the chart.


