Bollinger Bands
Bollinger Bands are a technical analysis tool consisting of a set of trendlines with two standard deviations, positive and negative, plotted around a simple moving average (SMA) of an asset's price (which can be adjusted to user preferences).
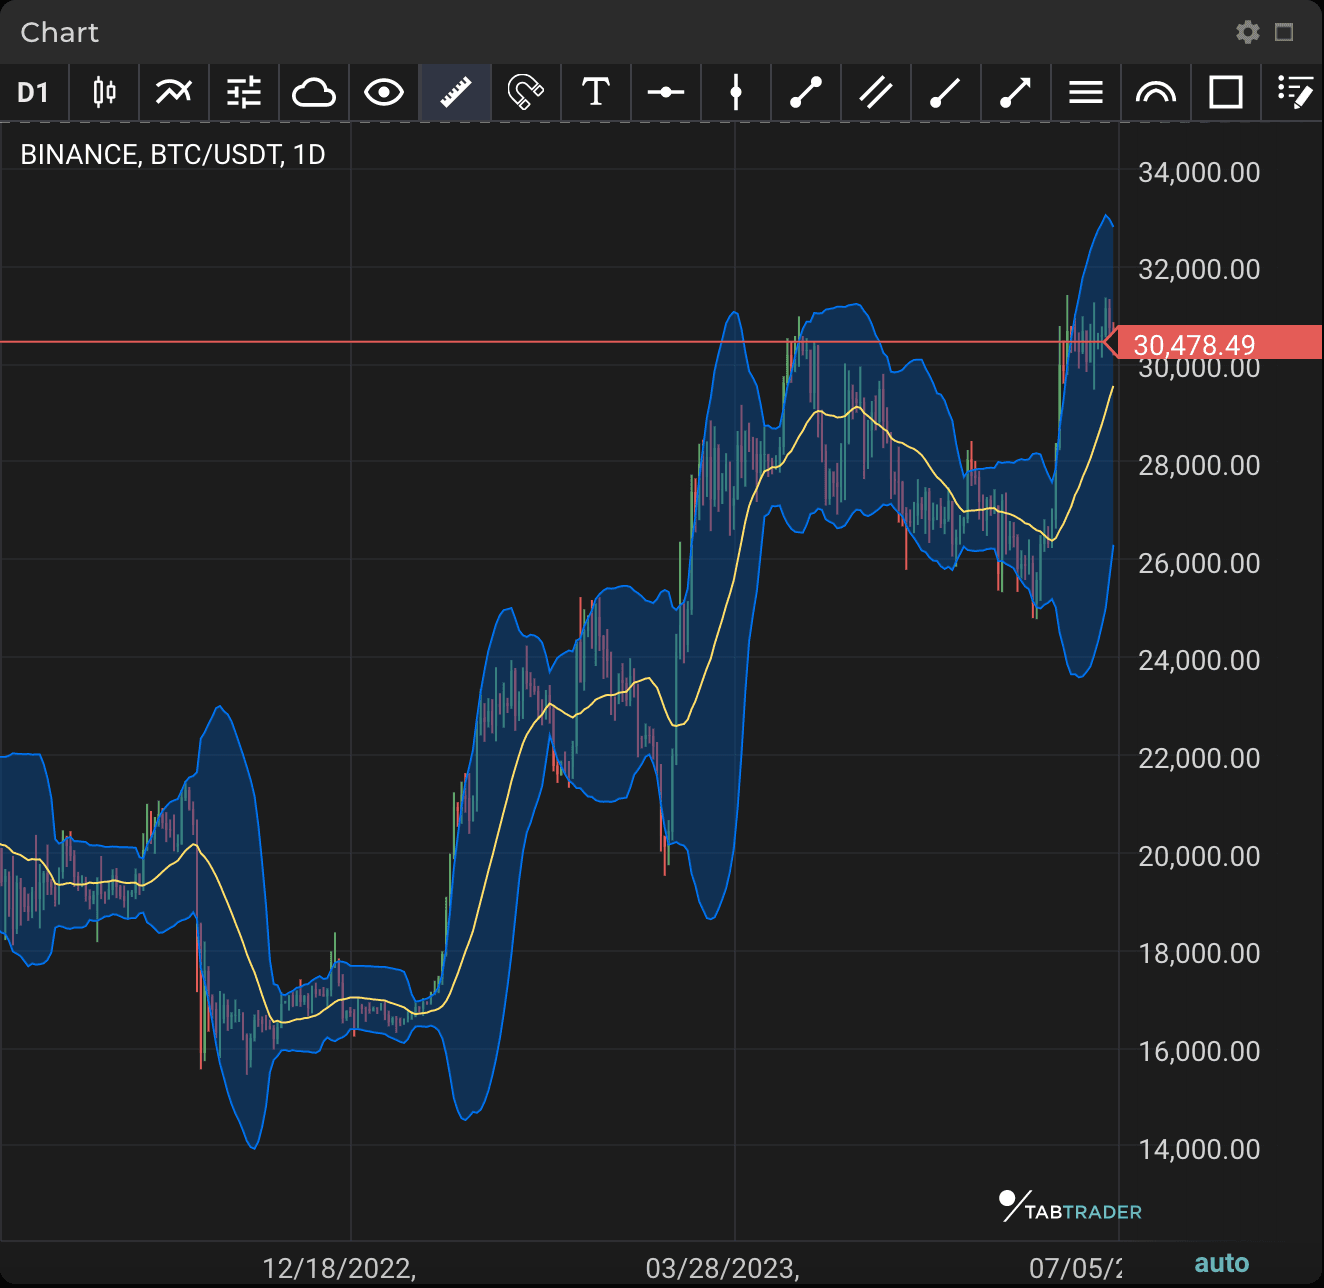
Standard deviation’s function here is to measure volatility, and Bollinger bands thus rearrange themselves according to market conditions. Market volatility is expressed in the width of the bands; the higher the volatility, the wider the distance between the bands and vice versa in less volatile periods.
Many traders believe that if price approaches the upper band, this is a sign of an overbought market, while price nearing the lower band indicates the market becoming oversold.
A move toward the upper band can preclude market strength, while an abrupt fall toward the lower band can show weakness.
One of the major concepts of Bollinger bands is called a squeeze. When the bands are situated close together, compressing the moving average, they form a squeeze. A squeeze signal shows a period of low volatility and can be considered as a potential sign of future increased volatility, and thus possible trading opportunities. On the contrary, the farther apart the bands move, the more likely the chance of a decreased price range entering in future. These conditions are not meant to be interpreted as trading signals; the bands do not indicate when the change happens, nor do they predict price direction.
BB
Calculation
BOLU=MA(TP,n)+m∗σ[TP,n]
BOLD=MA(TP,n)−m∗σ[TP,n]
where:
BOLU=Upper Bollinger Band
BOLD=Lower Bollinger Band
MA=Moving average TP (typical price)=(High+Low+Close)÷3
n=Number of periods in smoothing period (typically 20)
m=Number of standard deviations (typically 2)
σ[TP,n]=Standard Deviation over last n periods of TP


