Money Flow Index
The Money Flow Index (MFI) is a technical oscillator that uses price and volume data for identifying overbought or oversold signals. It can also be used to spot divergences which warn of a trend change. The oscillator moves between 0 and 100.
Unlike conventional oscillators such as the Relative Strength Index (RSI), MFI incorporates both price and volume data as opposed to just price. For this reason, some analysts call MFI volume-weighted RSI.
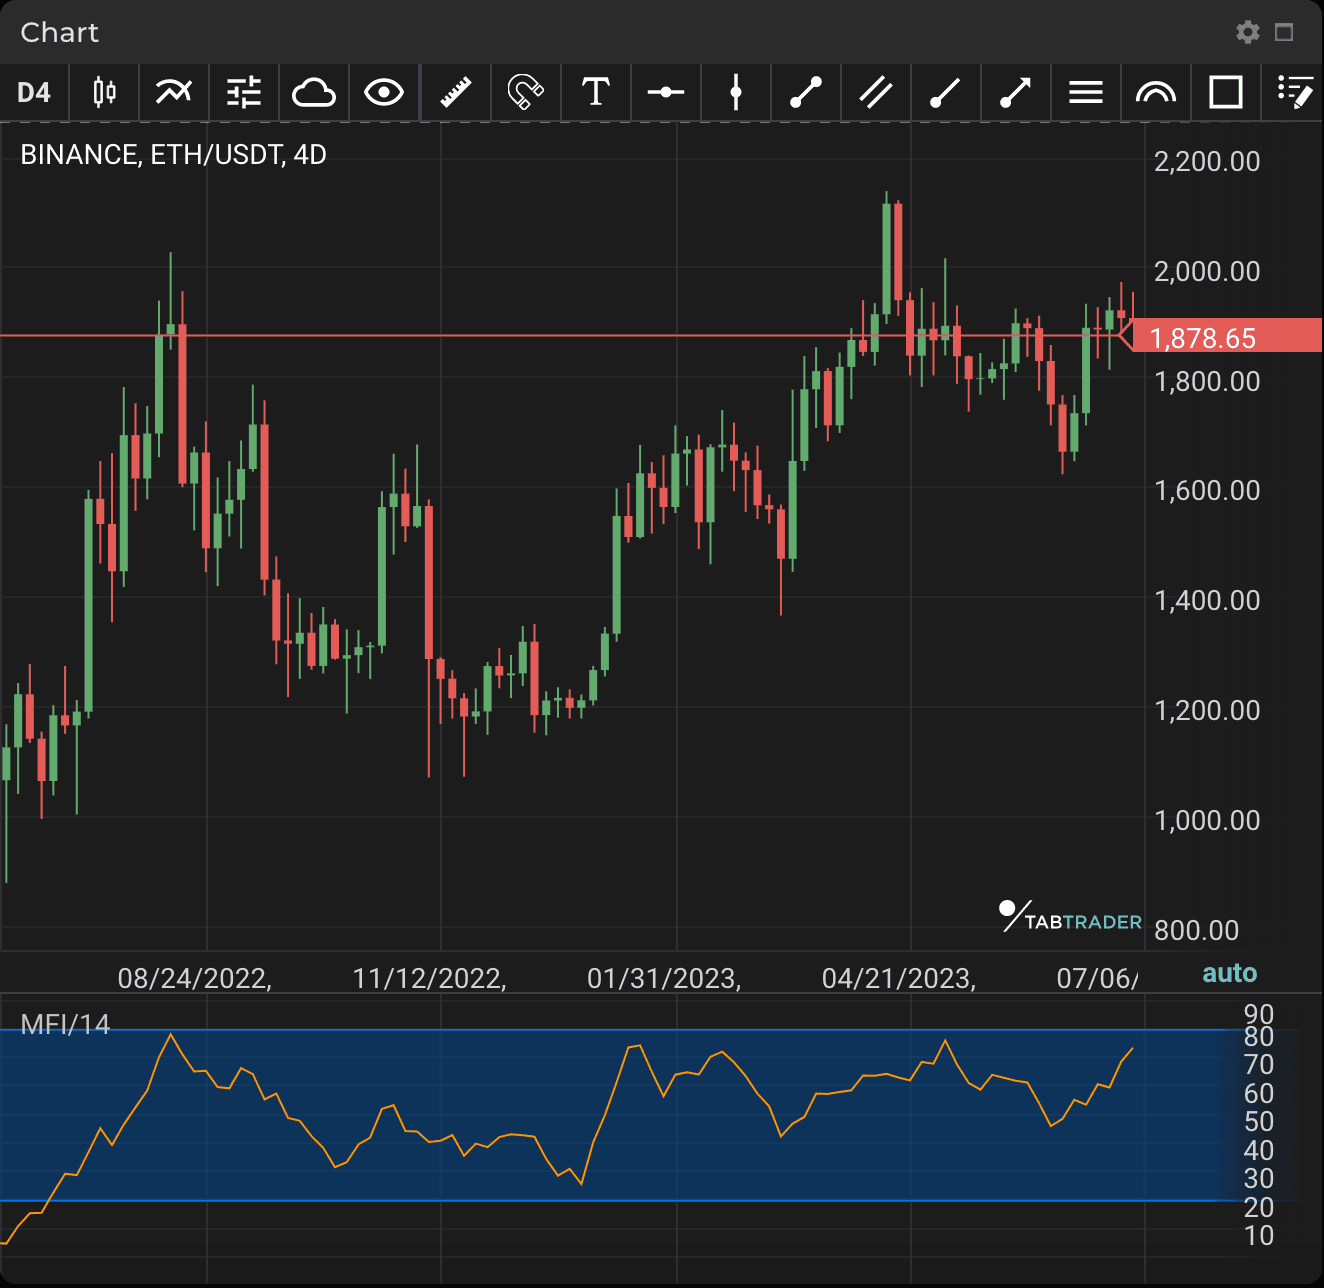
An MFI reading above 80 is considered overbought and an MFI reading below 20 is considered oversold, although levels of 90 and 10 are also used as thresholds.
One of the primary ways to use MFI is when there is a divergence. A divergence is when the oscillator is moving in the opposite direction to price. This is a signal of a potential reversal in the prevailing price trend. For example, a very high MFI reading that begins to fall below 80 while the underlying asset continues to climb is a price reversal signal to the downside. Conversely, a very low MFI reading that climbs above 20 while the underlying asset continues to sell off is a price reversal signal to the upside.
MFI
Calculation
Money Flow Index=100− 100/1+Money Flow Ratio
Where:
Money Flow Ratio=14 Period Positive Money Flow/14 Period Negative Money Flow
Raw Money Flow=Typical Price * Volume
(When the price is higher in the latest period compared to the previous one, Raw Money Flow is positive, so it is added to Positive Money Flow. When Raw Money Flow is negative because the price dropped that period, it goes to Negative Money Flow.)
Typical Price=3 High + Low + Close
MFI calculation can be performed using the following steps:
- Typical Price is calculated for each of the most recent periods (by default 14 periods).
- Each period is marked according to whether the typical price was higher or lower than the previous period. This will define Raw Money Flow as positive or negative.
- Raw Money Flow is calculated by multiplying the Typical Price by Volume for that period. Negative or positive numbers are used in the calculation depending on whether the period was up or down.
Raw Money Flow=Typical Price * Volume - The Money Flow Ratio is then obtained by adding up all the positive money flows over the last 14 periods and dividing them by the negative money flows for the last 14 periods.
- MFI is the result gained from the ratio found in step four.
- The calculations continue as each new period ends, using only the last 14 periods of data.


