About Chart
Chart
Trading page features all the essential TabTrader tools in one place, allowing you to analyze market data, trade and control your assets, install alert notifications for price changes and navigate to other instruments without leaving the page.
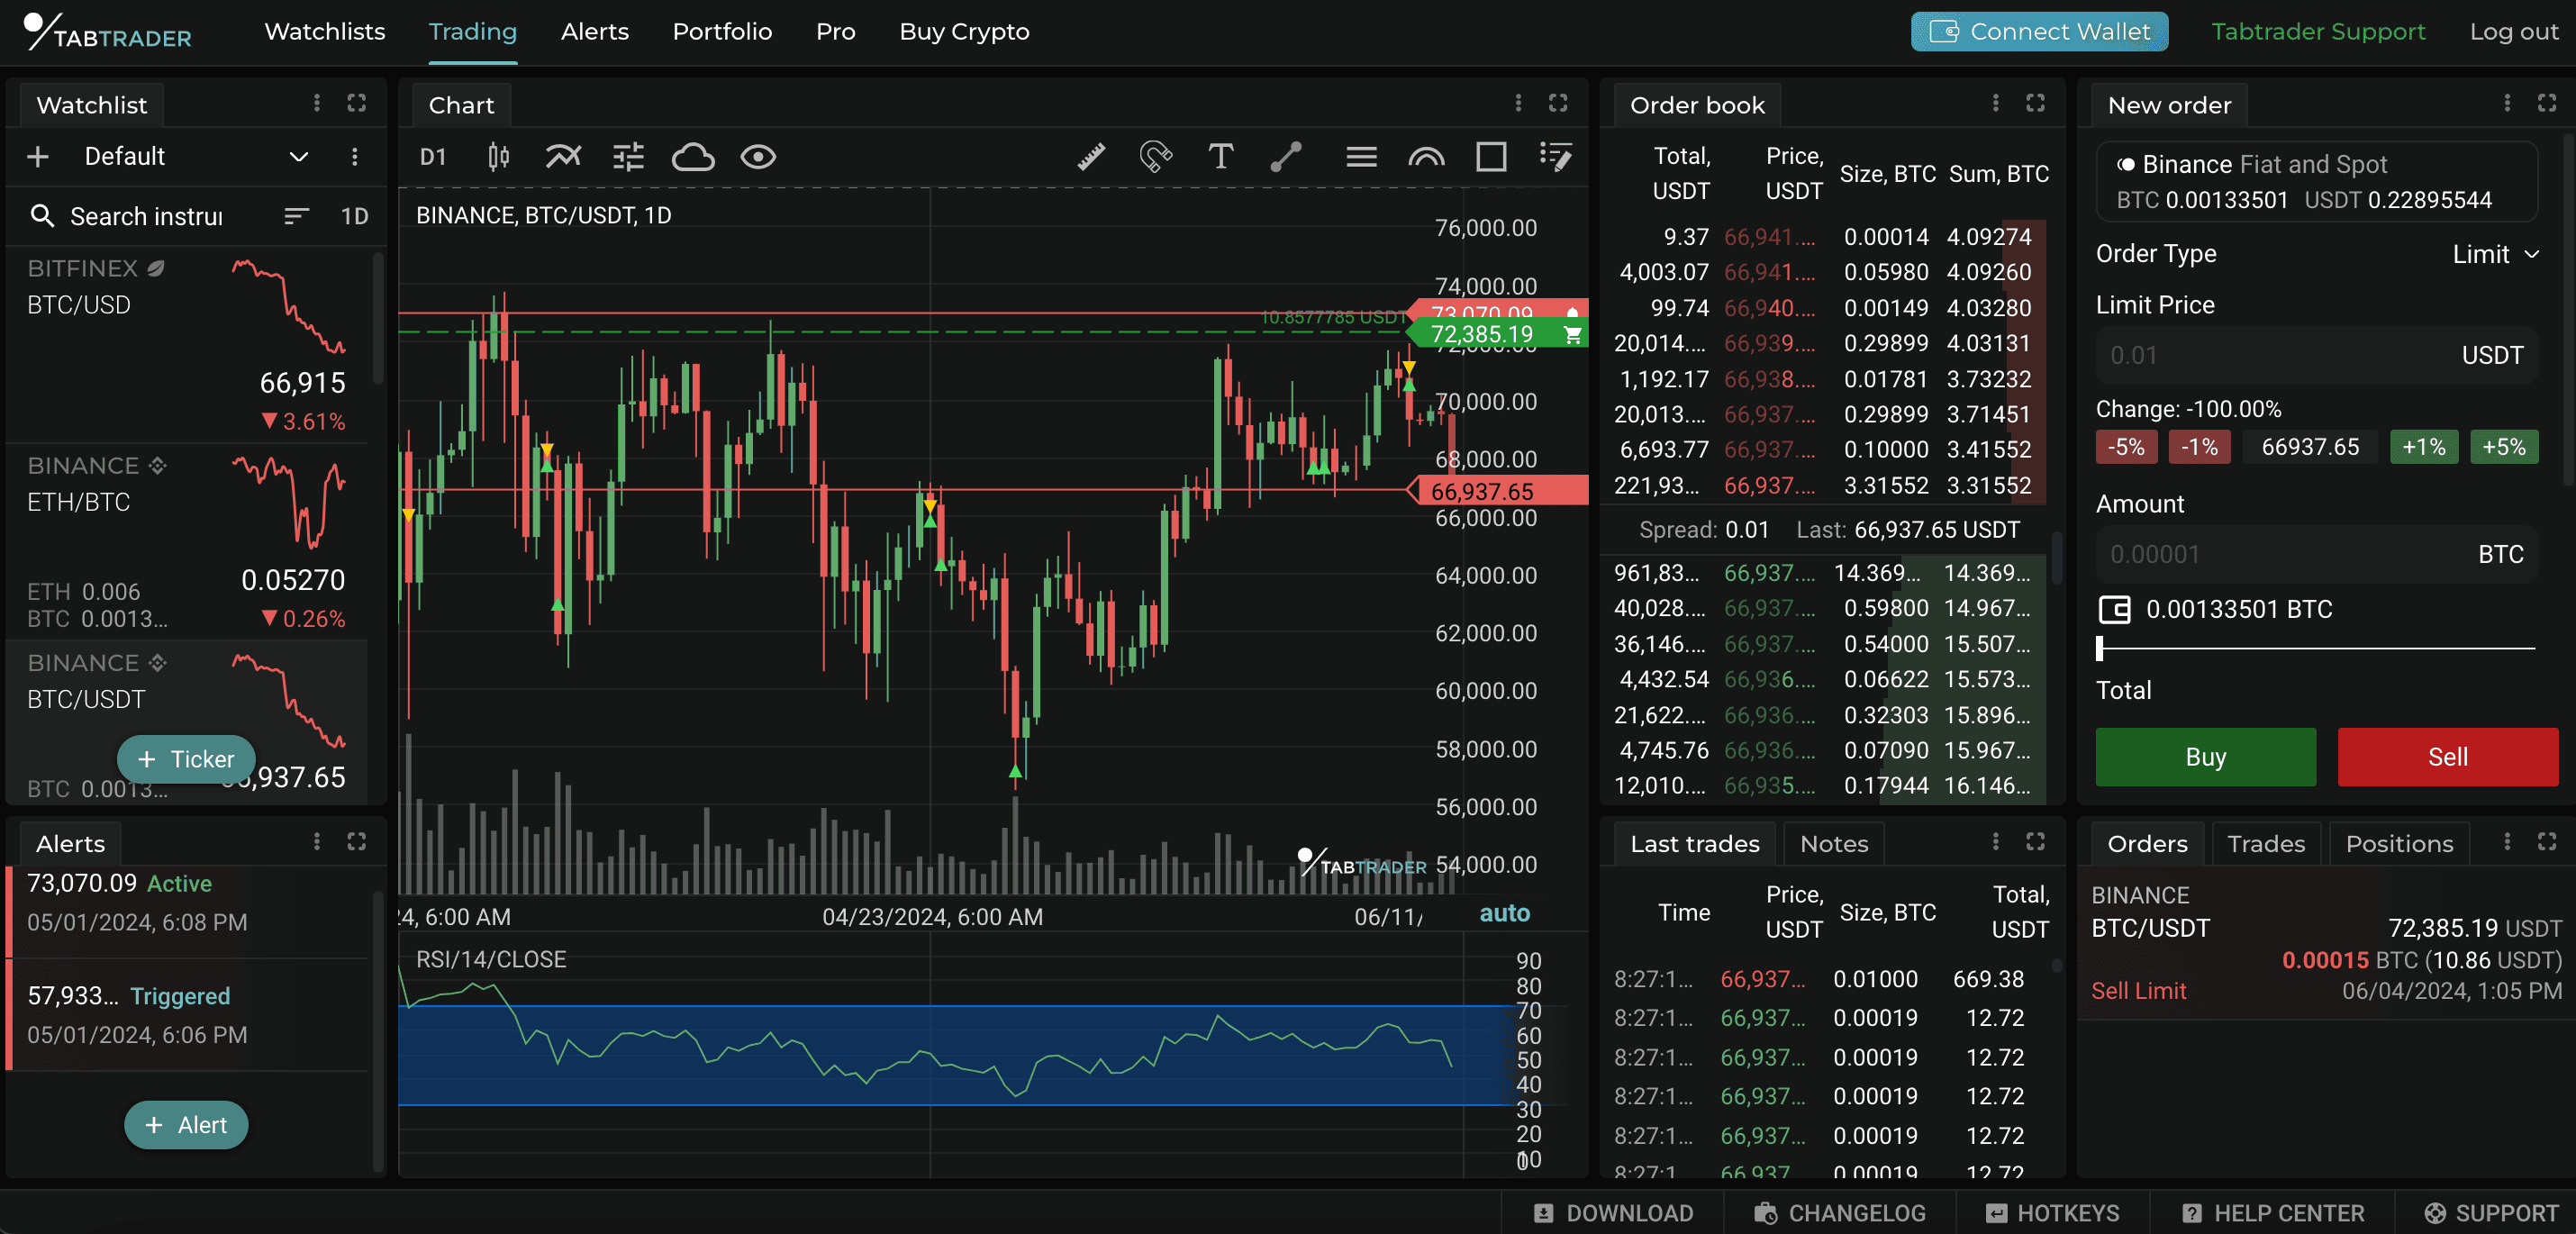
Trading page
A chart is a graphical representation of price movement that can be created via the use of various components such as trend lines, candlesticks, bars, Heikin Ashi candles and more.
To display price charts we utilize our proprietary charting library; no third-party chartings are used. They are interactive and allow you to place alerts, draw shapes, choose colors, change chart types, use the measuring tool and add indicators. You can also zoom in/ out and scroll up and down on a chart.
Chart toolbar
The Chart module is equipped with a toolbar right at the top of its screen. The following chart settings are located there, in order from left to right.
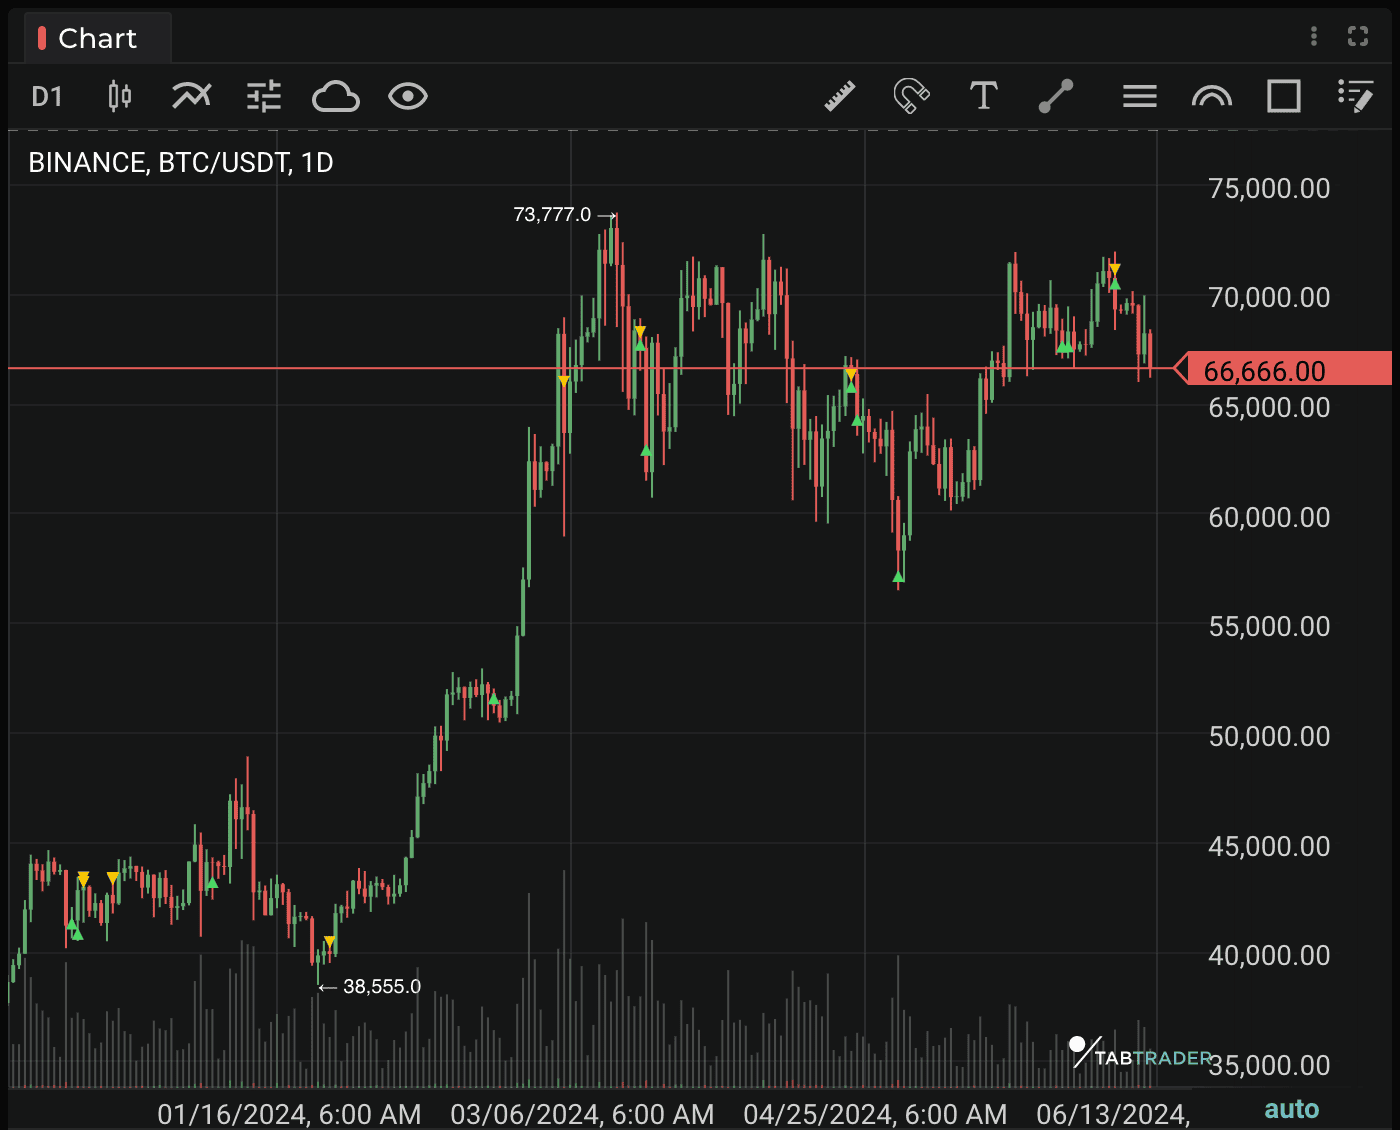
Chart module
Time frame
The time frame indicates the time period one candle represents. The larger the time frame chosen by a trader, the larger the time interval encapsulated in one candle on the chart (varies from one minute to one month).
Chart type
Representation of price movements in the form of candlesticks, Bars, Line, Heikin Ashi, Hollow Candles or Area.
Indicators
The list of indicators, where you can add indicators and modify their settings and view. More than 30 indicators are available on TabTrader in total, including Ichimoku Cloud, Volume Delta and CVD.
Chart Styling
Chart styling can be used to customize the appearance of a selected chart type.
Configurations
List of preconfigured templates of chart settings, such as: time frame, chart type, indicators, layers, that can be used on different charts.
Layers visibility
These settings allow you to show or hide objects on charts, such as alerts, orders, trades, indicators, shapes, local min and max prices and countdown timer.
Measure tool
Tool to measure distance, time and price change within a selected range.
Magnet
When drawing it makes the points of the shape snap to the values of Open, High, Low, and Close of the nearby candles. You can choose either weak or strong magnet mode.
Text
This tool allows you to make text notes directly on a chart.
Shapes
Apply shapes right over the chart to perform your technical analysis.
Horizontal line, Vertical line, Trend line, Parallel channel, Ray, Arrow, Fibonacci levels, Fibonacci arcs and Rectangle.
Shapes list
List of all shapes drawn on a selected instrument’s chart. You can edit, hide or delete individual shapes.
Shapes customization
For each shape you can set certain parameters and change its styling. When you select a shape on the graph, an additional menu appears with the shape settings and options to change color, lock, copy, and delete the shape. You can also edit, hide, or delete shapes under the shape list icon.


