What is the Ichimoku Cloud Trading Strategy?

What is Ichimoku Cloud Trading Strategy and How Do You Use It?
What is the Ichimoku Cloud?
Ichimoku Kinko Hyo, commonly known as the Ichimoku Cloud, is a system for trading financial assets — including crypto.
Created almost a century ago, Ichimoku comprises a whole suite of trading indicators with a wide range of applications and use cases.
Suitable for both beginners and experienced traders, the strategies enabled by Ichimoku are commonly applied to Bitcoin and altcoin trading.
The phrase Ichimoku Kinko Hyo translates from Japanese to “equilibrium chart at a glance” — reflecting the ability of an Ichimoku Cloud to deliver immediate information about a given market.
The Purpose of the Ichimoku Indicator

TabTrader app trading chart example with Ichimoku cloud indicator
Crypto traders can use the system to identify overall market direction and trend information — “at a glance”, as its name suggests. Beyond this, however, entry and exit points, areas of support and resistance and their likely strength, as well as trend reversals both genuine and fake, are all part of what Ichimoku analysis can offer.
Ichimoku leverages trading data from past and present in order to deliver signals and allow traders to understand how an asset might behave at a given price point.
It can be used with any asset, but volatility is a better fit for the system — something which further increases the scope of its application to crypto, almost 100 years after its creation.
How Does the Ichimoku Cloud Indicator Work?
Ichimoku consists of multiple components. While traders can exclude certain elements of it within specific strategies, knowledge of all of them is required to understand how the indicator works.

Calculating the Ichimoku Cloud simplified on TabTrader Academy
How to Calculate the Ichimoku Cloud
Conversion Line (Tenkan-sen) = (9-PH+9-PL)/2
Base Line (Kijun-sen) = (26-PH + 26-PL)/2
Leading Span A (Senkou span A) = (CL + Base Line)/2
Leading Span B (Senkou span B) = (52-PH + 52-PL)/2
Lagging Span (Chikou span) = Close plotted 26 periods in the past
Where:
PH=Period high; PL=Period low; CL=Conversion line
Chikou symbolizes the market's history, while Kijun and Tenkan embody its current state. Kumo, on the other hand, strives to encapsulate the market's future trajectory.

Formula for the Ichimoku Cloud indicator
What Are the Tenkan-sen and Kijun-sen?
In addition to the well-known cloud, Ichimoku consists of various trendlines. The first of these, which track price in real time, are the Tenkan-sen, also known as the signal line or conversion line, and Kijun-sen, or base line.
Both Tenkan-sen and Kijun-sen behave in a similar manner to moving averages — one of the most popular crypto trading indicators on TabTrader.
Unlike moving averages, however, which are based on the closing price of each candle, the two Ichimoku lines use the highest high and lowest low and divide the result by two for a given number of periods. The result is a measure of the market’s equilibrium.
Tenkan-sen reflects equilibrium for the past 9 periods, while Kijun-sen offers the same information for the past 26 periods. Their calculation is as follows:
Tenkan-sen = (9d high + 9d low) / 2Kijun-sen = (26d high + 26d low) / 2
The resulting trendlines visible as part of the Ichimoku indicator act as signals for traders. Whether buy or sell, bullish or bearish, the interplay between the two lines — as well as their position relative to other elements of the Ichimoku chart — are essential knowledge.
What Are the Senkou Spans Used in Ichimoku Clouds?
Ichimoku is best known for the so-called “clouds” it constructs on a chart. These are officially called Kumo Clouds, and are in fact the space between two lines, or “spans” — Senkou Span A and Senkou Span B, also known as Leading Spans.
On an Ichimoku chart, the Kumo cloud which results from the two spans appears in front of the latest price candles for an asset, hence their name.
Senkou Span A is calculated using the values from Tenkan-sen and Kijun-sen; the moving average of their two values for the past 26 periods, projected 26 periods into the future. Senkou Span B takes the highest high and lowest low for the past 52 periods, divides by 2 and is also projected 26 periods ahead.
The formulas for these are as follows:
Senkou Span A = (Tenkan-sen + Kijun-sen) / 2 plotted 26 periods aheadSenkou Span B = (52-period high + 52-period low) / 2 plotted 26 periods ahead
While this may sound complex, the resulting Senkou Span “cloud” is used to gain insight into future support and resistance levels once price arrives at the cloud’s position. The decision whether or not to take a trade also depends on price’s position relative to the cloud.
What Is the Chikou Span in Ichimoku Clouds?
The final basic component of the Ichimoku trading indicator is the Chikou Span, sometimes called the lagging span.
This name reflects Chikou’s position — contrary to the Senkou Spans, it lies 26 periods behind price. It is calculated using price itself, rather than data from Tenkan-sen and Kijun-sen. There is no calculation required to obtain its values.
Chikou Span = Current candle closing price, plotted 26 periods in the past
The Chikou Span functions as a frame of reference for price trend and direction. Ichimoku traders look back to what price was doing 26 periods previously compared to the current candle, and also note Chikou’s position relative to other chart features when considering the merits of a given trading opportunity.
How to Trade Crypto With the Ichimoku Cloud Indicator
Trading crypto or any other financial asset with Ichimoku is possible in any market under any circumstances — but volatility is a key driver of its utility. This makes it perfect for Bitcoin and altcoins, which can undergo bouts of significant volatility and experience a variety of reactionary price movements.
The indicator is flexible — its parameters can be changed, and not all of its components are essential in order to judge whether a trade will be successful.
Nonetheless, it is important to identify specific signals given by its various components, in particular a handful of base cases which inform a trade’s validity.
TK Crossover
On an Ichimoku Cloud chart, the indicator’s various lines will cross over and under one another. These events form trading signals, and their strength depends on the individual circumstances under which they occur.

The Tenkan-sen and Kijun-sen Crossover in the Ichimoku Cloud TabTrader Web Terminal
The first of these involves Tenkan-sen and Kijun-sen, and is known as a TK Crossover. As mentioned, Tenkan-sen is a 9-period equilibrium price calculation, and Kijun-sen is a 26-period equilibrium price calculation.
Given its larger reference period, Kijun-sen is slower to react to a price trend change than Tenkan-sen. In an uptrend, Tenkan-sen will be above Kijun-sen, while in a downtrend, Kijun-sen will be on top as Tenkan-sen reacts first to downside.
The moment when the two flip positions is the TK Crossover, which acts as a long and short signal, respectively. Price crossing above or below Kijun-sen — the more formidable support or resistance barrier due to its aforementioned longer reference period — reinforces a move, and can suggest that a trend change is beginning.
Kumo Twist
Another key cross involves the Kumo Cloud itself, composed of Senkou Spans A and B, and is known as a Kumo Twist.

The Kumo Twist in the Ichimoku Cloud on TabTrader Web Terminal
Due to the varying reference periods for Senkou A and B, crossovers between them also occur. The space between them is the Kumo Cloud, and on an Ichimoku chart, the Cloud’s color will change each time the two Spans cross.
This can act as a trend change signal, and thanks to the Spans’ role as a leading indicator, the upper and lower edge of the cloud can denote likely future support and resistance levels should a trader enter a trade.
How reliable those edges are depends on the thickness of the cloud. After a Kumo Twist, the cloud will logically be thin as it has only just begun to develop. If, however, it goes on to expand convincingly — especially if one edge is flat — it produces formidable support and resistance levels to bear in mind later. This in turn informs where a trader places a Stop-Loss level to protect profitability.
Kumo Breakout

The Kumo Breakout in the Ichimoku Cloud on TabTrader Web Terminal
One of two key trading signals involving an Ichomoku component and the price itself is the Kumo Breakout. Here, price may exit the Kumo Cloud after spending a certain period of time inside — internal movements are traditionally unreliable signals as they suggest a lack of trajectory.
If price breaks out beyond the Kumo ceiling or breaks down through support — especially a flat ceiling or support floor — this is an actionable signal to go long and short respectively.
Chikou Span Vs. Kumo Cloud
The Chikou Span can also inform a trader about the strength of a trend based on its interaction with the Kumo Cloud. Taking on a trade while Chikou is inside the Cloud carries more risk than if a breakout occurs or Chikou is already definitively above or below it.
Support, Resistance and Signal Strength
Aside from helping a trader identify the overall trend “at a glance” and the strength of that trend, Ichimoku delivers more specific details about certain price levels.
Support and Resistance
Crypto trading is volatile in and of itself, and knowing a cryptoasset’s support and resistance levels is an essential part of profitable trading. Ichimoku identifies both, and also suggests how strong a given support or resistance zone is or will be in future.
The main element used for support and resistance research is the Kumo Cloud. Its boundaries — Senkou Span A and B — form levels to note should price come into contact with them. The Span which forms the top edge of the cloud will be support in a downtrend and resistance in an uptrend, with the opposite for the Span at the bottom.
If price enters the Cloud, this is considered a less advantageous place to enter a trade — the actionable signal is when it pierces either Span.
Analyzing Ichimoku charts, it will also become apparent that both Tenkan-sen and Kijun-sen act as support and resistance levels for price. An asset will often ‘wick’ to one of these trendlines while preserving it as a line in the sand.
The chart below shows close interaction between BTC/USD and Tenkan-sen and Kijun-sen.
Ichimoku trendline interaction chart on TabTrader Web
Signal Strength
Each element of the Ichimoku system can function as an indicator of how strong a given trading signal is. Price’s interaction with the Tenkan-sen and Kijun-sen trendlines, the Kumo Cloud and the Chikou Span determines the suitability of an entry point at a specific price level.
For example, a strong entry point in a downtrend would see price trading below all these items and for the Chikou Span itself to be below price and the Cloud 26 periods previously. This would imply that major support levels have broken down, and a short trade should be able to profit from extended downside thanks to strong momentum indicated by Chikou’s position.
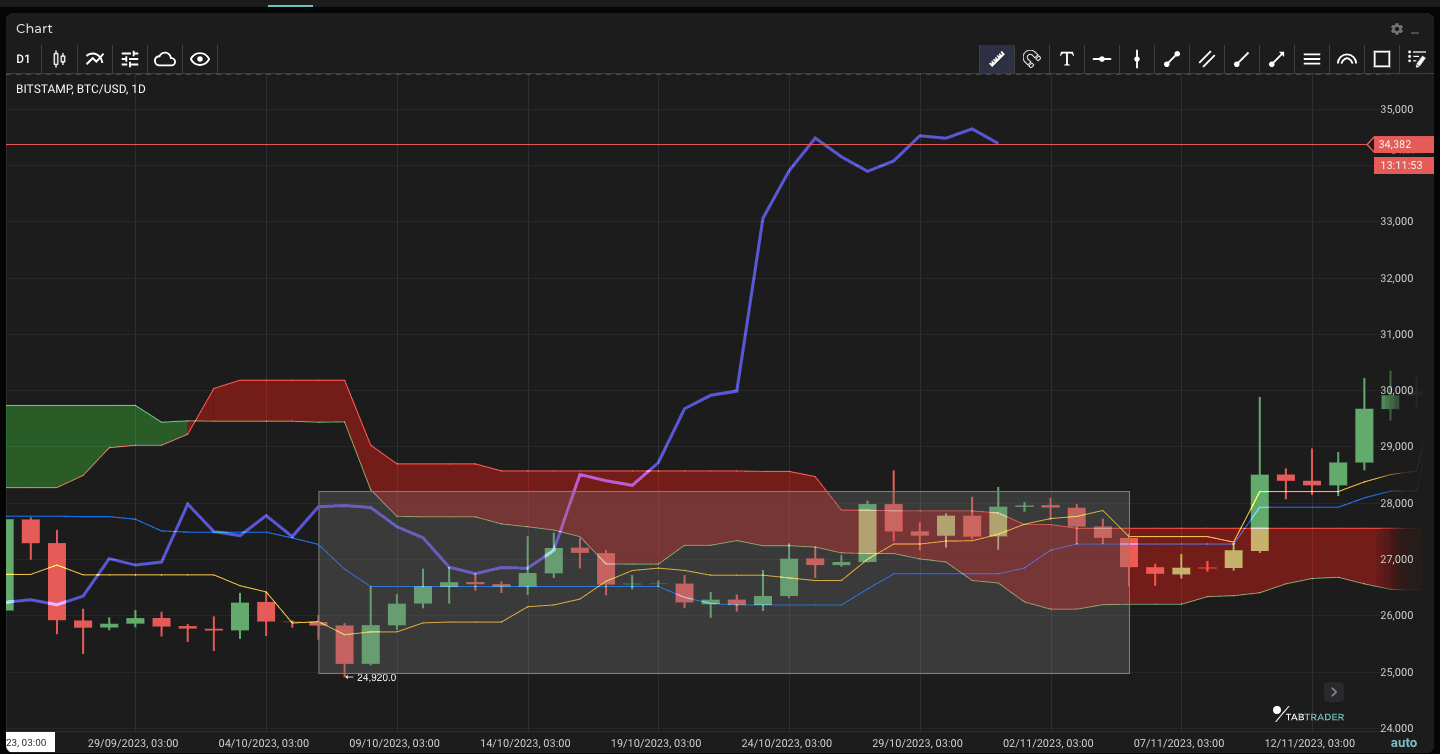
The chart below shows a strong long entry point for BTC/USD. The highlighted candle occurs with price having broken above the Kumo Cloud — a Kumo Breakout — following a TK crossover. The Chikou Span 26 periods prior (purple), as shown by the white line, is also now above the Cloud, signaling strong momentum.
Here, a Stop-Loss could be placed at the top of the Cloud, or for a tighter Stop-Loss, at Kijun-sen.
Ichimoku Cloud long setup on TabTrader Web
If one of more of these characteristics is missing, the validity of the entry point is not as certain. In particular, if price has not cleared the Cloud and is coming up against the Senkou Span, there is a probability that it could reverse or linger inside with the Span supporting the market, endangering a short’s profitability.
Furthermore, if the Chikou Span is “inside” price — creating a congested area at the given entry point — this adds to the likelihood of a trend failing to materialize.
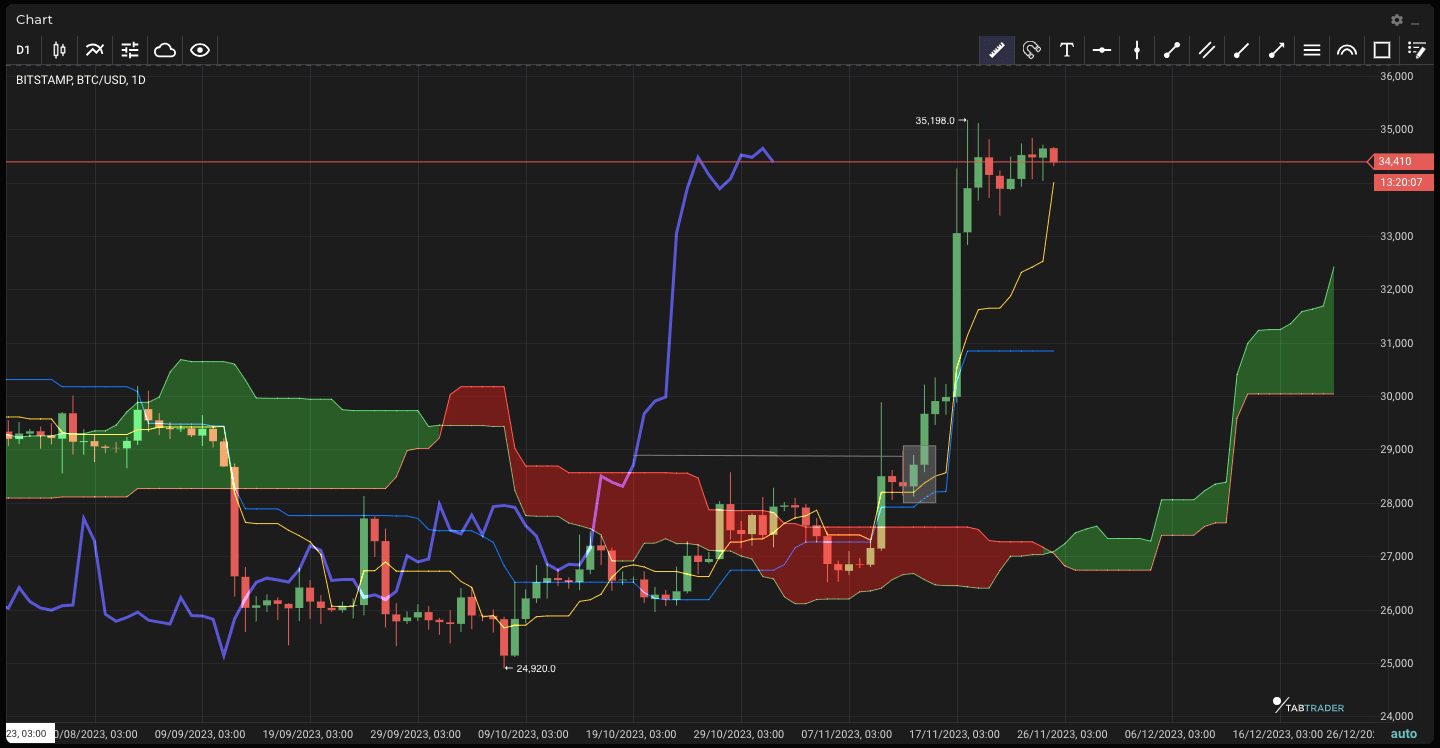
The chart below shows the highlighted candle breaking down below the Cloud. At the same time, however, Chikou 26 periods prior (shown by the white line) is both inside price and the Cloud, suggesting a lack of a clear downtrend and suitable momentum. Price is also approaching potential support in the form of Tenkan-sen and Kijun-sen. Price did continue lower, but soon abandoned its downward trajectory.

Ichimoku contested short setup on TabTrader Web
A final aspect to note on signal strength is price’s position relative to Tenkan-sen and Kijun-sen. Even in what looks like a clear up or downtrend, an entry may lack profit potential if taken while price is far away from these trendlines. Ichimoku states that it will inevitably return closer to them, thus cooling the intensity of its trend.
Pros and Cons of the Ichimoku Cloud Strategy
Ichimoku is designed to deliver as much information about an asset’s performance as possible “at a glance”.
It provides market trading insights across multiple timeframes, allowing observers to understand an asset’s trend, support and resistance levels, as well as identify suitable entry and exit points.
That said, there are certain drawbacks to the system which may hinder those who are either not used to it or who attempt to combine its signals with other trading instruments.
As mentioned, Ichimoku is also less useful for markets that are not trending. Sideways price action can result in mixed messages from its various components, increasing the risk of unsuccessful or loss-making trades — especially those using leverage.
| Ichimoku Pros | Ichimoku Cons |
| Trend, support/resistance, entry levels visible immediately. | Large volume of information at once can become confusing when used with other indicators. |
| Trading signals displayed for past, present and future performance. | Trading on impulse without considering retrospective data increases risk. |
| Momentum insights to identify a trend’s strength increase likelihood of trade profit and reduce risk/uncertainty. | Sideways markets without a conspicuous trend can deliver mixed trading signals. |
The Bottom Line
The Ichimoku Cloud is unique among crypto and financial trading tools and one of TabTrader’s most popular instruments.
Through comparatively simple calculations, its trendlines provide key insights into past, present and future trading behavior of an asset — and all that data is truly visible “at a glance”, as its original Japanese name suggests.
Thus, anyone with the expertise can read Ichimoku trading signals and understand, either immediately or within a short space of time depending on the information required, what is happening in a given market.
Ichimoku is flexible, and its parameters can be changed to trade ‘nontraditional’ methods — with the increased risk which may be attached.
Essentially, however, the system is highly user friendly, and even beginners are able to utilize its signals to improve their trading — especially on volatile crypto markets, which suit Ichimoku better than rigid, sideways environments.
TabTrader provides users with the power to harness crypto trading instruments like Ichimoku and deploy them across the world’s biggest exchanges.
Our unique all-in-one trading terminal means no more manual monitoring of exchange accounts, endless browser windows and missed trading opportunities. Do it all with the TabTrader app for iOS, Android and Web — download it here.
New to crypto trading and want to find out more about how it works? The TabTrader Academy features comprehensive guides on all aspects of the world of crypto.
FAQ
How effective is Ichimoku?
Ichimoku is a highly versatile tool for trading assets including cryptocurrencies. Bitcoin and altcoins especially lend themselves to Ichimoku analysis thanks to their volatile nature.
Does the Ichimoku Cloud really work?
Ichimoku has existed for nearly a century and has been in active use on mainstream financial markets for many decades. Its adaptive nature means that it can be used across multiple timeframes and asset classes, and crypto is no exception. If used correctly, it can identify trends, support and resistance levels and suitable entry and exit points for future trades.
Is Ichimoku a leading or lagging indicator?
Different components of the Ichimoku Cloud deal with different timeframes. The Cloud itself is placed in front of price action, while the Chikou Span identifies price traits from the past. As such, both leading and lagging indicator signals are present within Ichimoku.
What are the disadvantages of Ichimoku for crypto traders?
Ichimoku is well suited to analyzing volatile markets, and thus crypto is a good fit for the indicator. However, when unexpected events occur, the historical data upon which it relies may produce false signals. Similarly, sideways or rangebound trading with little momentum can create problems identifying entry points with Ichimoku.
If you still have questions about Ichimoku Cloud indicator - you can read a special article in our Help Center.


