Crypto Market Weekly Outlook: Why Bitcoin Is Dropping and What to Watch This Week (March 23–27, 2026)
Key takeaways
- Week-over-week, Bitcoin has been dragged lower by a mix of rising crude prices, mounting costs tied to the US–Israel–Iran conflict, and renewed inflation concerns.
- Ethereum led last week, but that didn’t carry over. It’s now lagging behind Bitcoin and struggling to find a clear driver.
Why is Bitcoin dropping this week?
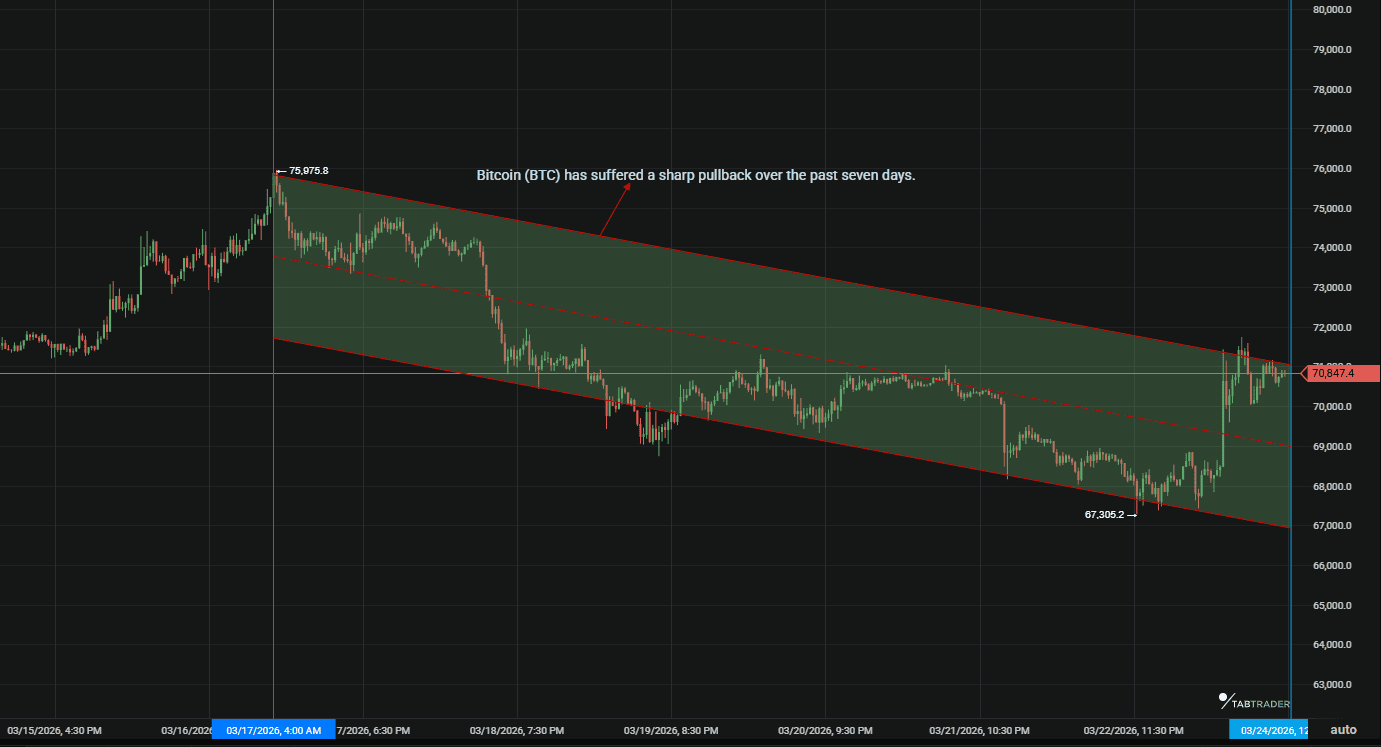
Bitcoin (BTC) has suffered a sharp pullback over the past seven days. The move began with a strong rejection at the $76,000 level on March 17, followed by accelerated selling that pushed the price below $70,000.
Once that psychological level broke, sentiment shifted quickly. Traders are now questioning whether the market has found a bottom or if this is simply a pause before further downside.
The move did not happen in isolation. Broader financial markets also weakened due to:
- Rising crude oil prices earlier in the week
- Escalating geopolitical tensions in the Middle East
- Reduced expectations for interest rate cuts by the Federal Reserve
More recently, oil prices have dropped sharply to around $96.96 per barrel as tensions showed signs of easing, which has helped Bitcoin recover toward the $70K region. This shift in oil markets has slightly improved risk sentiment.
Key macro drivers
Geopolitics and oil prices
The dominant macro driver this week is the ongoing clashes in the Middle East. To put it simply, geopolitical tensions aren't easing. Concerns over the Strait of Hormuz have pushed oil to $100, bringing inflation back into focus just as markets were starting to think the worst was behind them. That’s not a great combination.
The Fed also played a part this week. The March 17–18 FOMC meeting landed as a hold, but not a neutral one. The updated dot plot now points to just a single rate cut for the rest of 2026, which is tighter than markets had hoped. That shift keeps liquidity expectations in check and caps upside across risk assets.
You can see it in correlations. Bitcoin is moving more in line with the S&P 500 and Nasdaq again, and capital is rotating into the US dollar and gold. Crypto tends to absorb much of the forced selling when positioning gets crowded, and that’s been evident over the past few sessions.
As of writing, the market is firmly risk-off. Rallies are getting sold into rather than chased, and that dynamic usually sticks around until there’s a clear shift.
Bitcoin (BTC) price analysis
Despite losing approximately 7% over the past 7 days, Bitcoin remains resilient compared with Altcoins.
Looking at the weekly chart, the structure has taken a hit. Price has slipped below the lower boundary of its long-term rising channel, which usually signals a loss of trend strength. That doesn’t always mean a sharp breakdown, but it often leads to slower, sideways movement or a grind lower.
BTC/USDT
All prices are at time of writing and subject to change. Refresh charts on TabTrader for live data.
Momentum has clearly cooled off with concerns about inflation and geopolitical instability. Consequently, the recent pullback has flattened the range, and it's starting to look less like a continuation setup and more like a market reset.
Macro is still hanging over everything. The Fed remains the main variable here. If policy expectations tilt more hawkish from here, the US dollar is likely to strengthen again, which tends to lean against BTC in the short term. That dynamic hasn’t changed.
Key Bitcoin price levels
- Support sits around $68,800, with a deeper level near $63,000 if things accelerate lower.
- Resistance is clustered at $70,000, then rises to the $73,400 area near the 50-day moving average.
Key technical indicators
RSI is drifting into the mid-40s. That’s getting stretched enough to allow for a bounce, but not extreme. MACD has already rolled over with a bearish cross on the daily, so momentum still favors the downside for now.
Chart note
On the chart, BTC is riding the lower edge of a descending channel. If price dips below $68,000 and snaps back quickly, that kind of move tends to trap shorts and can fuel a push back toward the low $70Ks. Worth watching, but it needs to happen cleanly.
In the short term, the bias remains neutral to slightly bearish until support holds. A stable hold around $68.8K would at least give the market something to build on.
For any remarkable shift in tone, price needs to reclaim $72,000 and hold it. A break back above $74,000 would change the structure more meaningfully and put continuation back on the table. Until then, rallies are likely to run into sellers.
Ethereum (ETH) price analysis
Ethereum led last week, but that didn’t carry over. It’s now lagging behind Bitcoin and struggling to find a clear driver. This week, there’s no strong narrative in play, so it’s drifting.
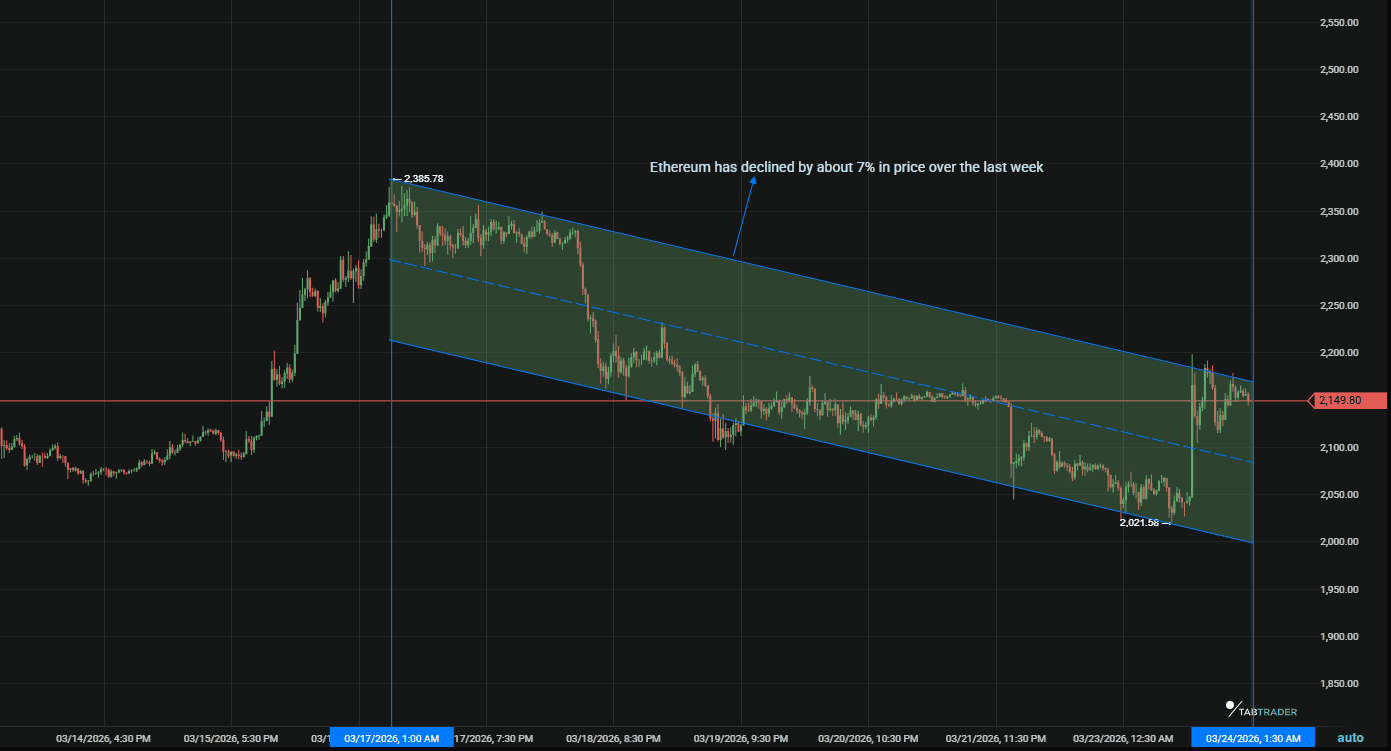
Price action reflects that. ETH is down about 9% on the week, but trading activity is still elevated. That usually points to distribution rather than accumulation, especially in a market that already feels heavy.
The ETH/BTC pair isn’t helping either. It’s slipped to around 0.0302, which is a multi-month low. Capital is sticking with Bitcoin for now. When things get uncertain, the market tends to consolidate into BTC first and ask questions later.
ETH/USDT
Ethereum key levels
- The $2,100 level is doing most of the work right now. As long as that holds, ETH can stay in a slow grind range. If it gives way, the structure opens up quickly, and a move toward $1,800 becomes a realistic downside path.
Major altcoin sector overview
Layer 1 tokens (SOL, AVAX, ADA)
Layer 1s like SOL, AVAX, and ADA are still the most active part of the alt market, but they’re not immune. Price action is leaning bearish, and they’ve been slipping against BTC. Solana in particular, is sitting right on support around $86. That level matters: lose it, and the unwind in long positions probably accelerates.
DeFi tokens (AAVE, UNI, MKR)
DeFi names, AAVE, UNI, and MKR, aren’t holding up much better. Sentiment took a hit after the $25M USR stablecoin exploit, and such events tend to linger. Even if fundamentals haven’t changed much, capital is becoming more cautious about the sector.
Gaming and metaverse tokens (AXS, MANA)
Gaming and metaverse tokens like AXS and MANA are, as usual, taking it the hardest. They’re typically the first to get sold when macro turns risk-off, and that’s exactly what’s happening. Liquidity dries up quickly there, and without strong inflows, they tend to just drift lower.
Altcoin sector summary
According to our analysis, the tone across altcoins is broadly weak. There’s no real outperformance anywhere. There are just varying degrees of underperformance versus Bitcoin.
Despite this, layer 1s still have the best chance of stabilizing first simply because liquidity is concentrated there. Gaming and metaverse assets, on the other hand, are sidelined for now. Until their risk appetite comes back, they’re mostly just sitting there.
Market metrics and sentiment
- Fear & Greed Index: 27 (Fear). This is a sharp drop from 55 last month.
- BTC Dominance: 58.8%. This indicates a flight to quality. This shows that traders are exiting altcoins and sitting in BTC or stables to wait out the storm.
Key crypto events and economic data to watch this week
- Tuesday, March 24: Productivity & Costs (R) data; look for signs of a slowing US economy.
- Friday, March 27: Core PCE Price Index (Inflation gauge). This is the Fed's favorite metric. A hot print will kill any hope for a spring rate cut.
Bitcoin price scenarios for the week ahead
Bullish scenario
If Bitcoin holds $68,800 on a daily close and pushes back above $71,500, the tone shifts a bit. That kind of move usually means the forced selling is out of the way, at least for now. A stabilization in Middle East headlines would help here, but the price still needs to do the work. Reclaiming that range would put the market back on firmer footing.
Neutral scenario
The more likely near-term outcome is just chop. Price rotates between roughly $68,500 and $71,000, volume fades, and nothing really resolves. That kind of environment tends to show up ahead of data releases, in this case, the PCE inflation print later in the week. Traders step back, positioning gets lighter, and the market goes sideways.
Bearish scenario
This would happen if $68,000 breaks with conviction. That level has been acting as a line in the sand, so losing it cleanly opens the door to a faster move down. There’s a cluster of stops sitting below, and once those start getting hit, the price can slide quickly toward the $63,000 area.
Bottom line
Over the next few days, the level that matters is $68,800. Everything is orbiting around it. If Bitcoin can hold there despite the macro pressure, it suggests there’s real demand underneath the market.
If that level starts slipping, the tone changes quickly. So far, it’s acting like a pivot, not a guaranteed floor. From a positioning standpoint, this isn’t a great environment to force trades.
FAQs
1. Why is Bitcoin dropping this week?
Bitcoin has been pressured by a combination of rising inflation concerns, ongoing geopolitical tensions in the Middle East, and the Federal Reserve's more hawkish rate cut projections for 2026.
2. What is the most important Bitcoin price level right now?
The key level to watch is $68,800. If Bitcoin holds this support on a daily close, the market can stabilize and potentially build toward a recovery. If it breaks, downside could accelerate toward $63,000. On the upside, reclaiming $71,500–$72,000 would signal a more meaningful shift in momentum.
3. Can Bitcoin recover above $70,000 this week?
Yes, but the path depends on macro conditions. A continued decline in oil prices and stable or softer-than-expected inflation data on Friday could support a move back above $71,500. However, a hot Core PCE print on March 27 would likely kill any near-term rally attempt and keep Bitcoin under pressure.
Important Note: TabTrader does not provide investment, tax, or legal advice, and you are solely responsible for determining whether any financial transaction strategy or related transaction is appropriate for you based on your personal investment objectives, economic circumstances, and risk tolerance. Tab Trader may provide information that includes but is not limited to blog posts, articles, podcasts, tutorials, and videos. The information contained therein does not constitute investment advice, financial advice, trading advice, or any other sort of advice, and you should not treat any of the content as such. TabTrader does not recommend that any digital asset should be bought, earned, sold, lent out, or held by you, and will not be held responsible for the decisions you make.