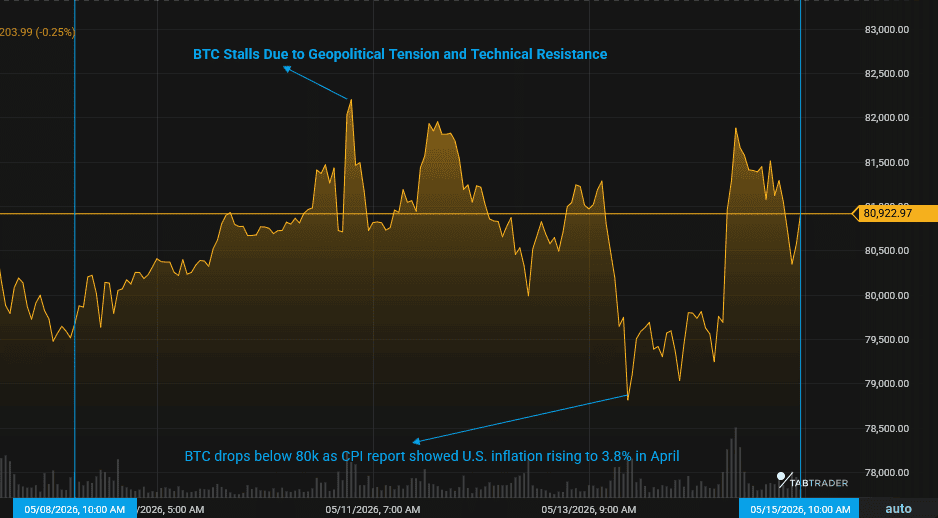
Crypto Chart of the Week: BTC drops below 80k as the market hits a Wall of Geopolitical Tension and Technical Resistance.
Key takeaways
- This week, BTC pushed toward the $83,600 resistance zone, but the move stalled. Sellers, primarily institutional, stepped in pretty quickly, and rising geopolitical tension didn’t help either.
- Crypto markets turned cautious after the latest CPI report showed U.S. inflation rising to 3.8% in April, the highest reading since May 2023.
- Spot Bitcoin ETFs continued recording inflows early in the week, helping cushion the initial decline.
- Ethereum showed notably weaker price action than Bitcoin, printing a series of lower local highs over the past month.
Track Bitcoin and other markets live on TabTrader. Sign up today to analyze charts in real time.
What happened this week in Crypto?(May 11-15)
Bitcoin came into the week with decent momentum and looked set to post a sixth straight green week. Early on, it pushed toward the $83,600 resistance zone, but the move stalled there. Sellers stepped in pretty quickly, and rising geopolitical tension didn’t help either.
After the rejection, price drifted lower and spent most of the week stabilizing around the $80,000–$81,000 area. That range has held up reasonably well so far, which matters more right now than aggressive upside attempts.
As the week wraps up, Bitcoin is sitting below $80k, and the broader market feels cautious. There’s support around $79,489, but trading volume has been fairly thin. This is usually a sign that traders would rather wait for clearer conditions than force positions in a messy news cycle.
The market isn’t panicking, but conviction isn’t especially strong either.
BTC/USDT.
BTC/USDT: Refresh the chart to get the latest prices.
What forces drove crypto volatility this week?
A mix of positive and negative news drove BTC above 81K, then down below 80K. Here are the major ones.
1. Hotter than expected U.S. inflation data
Crypto markets turned cautious after the latest CPI report showed U.S. inflation rising to 3.8% in April, the highest reading since May 2023. The data came in above expectations, which pushed Treasury yields and the U.S. dollar higher. That usually puts pressure on risk assets, and crypto felt it almost immediately.
2. Institutional money kept flowing in
Spot Bitcoin ETFs continued attracting inflows during the first half of the week. That helped prevent a sharper selloff and reinforced the idea that larger investors are still treating Bitcoin as a long-term allocation rather than a short-term trade.
3. Geopolitical tension reversed the mood
Mid-week sentiment shifted after reports that President Trump rejected a peace proposal tied to Iran negotiations. Concerns about Middle East stability and the Strait of Hormuz resurfaced quickly, prompting traders to move into defensive positions. Bitcoin was caught up in the broader risk-off reaction alongside equities and other speculative assets.
4. Technical resistance added pressure
On the chart side, Bitcoin’s rejection near the $82,600 resistance zone mattered more than traders expected. Once the price failed to break through, momentum traders started trimming exposure. A developing double-top structure on the total crypto market cap chart heightened caution and accelerated profit-taking across the market.
BTC/USDT: BTC caught in a liquidity squeeze
BTC/USDT.
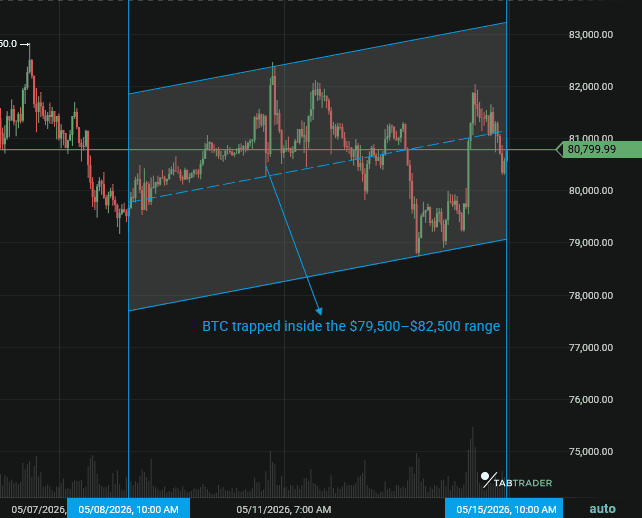
What this weekly chart shows: Bitcoin is stuck in a fairly tight liquidity battle between the 200-day SMA near $82,500 and the psychological support zone around $80,000. The recent futures wipeout helped reduce excess market leverage, so the order book looks cleaner than it did a week ago.
Even so, price is still trapped inside the $79,500–$82,500 range, and the next short-term trend probably won’t become clear until BTC closes decisively outside that band.
Over the last seven days, market structure shifted from straight-line bullish momentum to consolidation. Leverage came out of the system, traders started reducing exposure, and momentum cooled after repeated failures near resistance.
According to our analysis, Bitcoin is sitting at an important inflection point. Bulls have defended the broader structure so far, but the market no longer has the same one-sided momentum it had earlier in the month.
So, from our perspective right now, this looks more like a positioning battle than a breakout environment.
BTC/USDT: Weaker setup compared to BTC/USDT
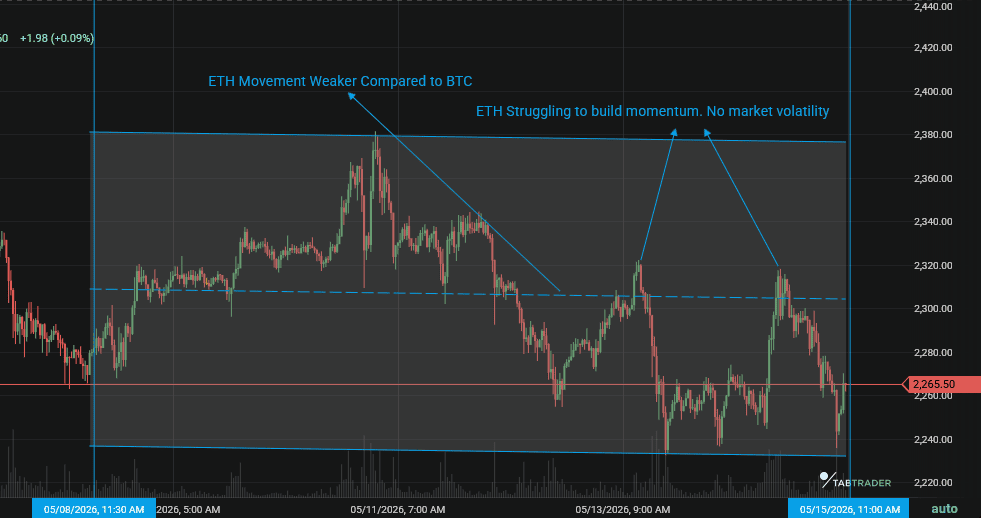
ETH/USDT.
What this chart shows: Over the past week, Ethereum has looked noticeably weaker than Bitcoin from a technical standpoint. While BTC spent most of the period testing resistance and at least attempting upside continuation, ETH struggled to build momentum and slowly gave back much of its late-April recovery.
The daily chart has also started printing a series of lower local highs over the past month.
At this stage, ETH appears to be squeezed into a decision point. The narrowing wedge pattern reflects a market losing volatility while traders wait for direction. Those setups rarely stay quiet for long. Eventually, the range breaks, and when it does, the move tends to come fast.
As of now, though, Ethereum still lacks the relative strength Bitcoin has maintained, even as the broader market cools off a bit.
FAQs
1. Why did Bitcoin’s price drop mid-week after a strong 5-week rally?
While Bitcoin started the week with strong momentum toward $83,600, it ran into a combination of technical resistance and macroeconomic shocks.
2. What is the most critical technical level for Bitcoin right now?
The defining technical battleground is the 200-day Simple Moving Average (SMA) at $82,500. Bitcoin repeatedly failed to break and close above this level on the daily chart last week.
3. Why is Ethereum underperforming compared to Bitcoin?
Ethereum is experiencing a capital lag due to Bitcoin's dominant market share (58.2%). In times of macroeconomic and geopolitical uncertainty, capital tends to cluster in Bitcoin, the market leader, before rotating into altcoins.
Track Bitcoin and other markets live on TabTrader. Sign up today to analyze charts in real time.
Important Note: TabTrader does not provide investment, tax, or legal advice, and you are solely responsible for determining whether any financial transaction strategy or related transaction is appropriate for you based on your personal investment objectives, economic circumstances, and risk tolerance. Tab Trader may provide information that includes but is not limited to blog posts, articles, podcasts, tutorials, and videos. The information contained therein does not constitute investment advice, financial advice, trading advice, or any other sort of advice, and you should not treat any of the content as such. TabTrader does not recommend that any digital asset should be bought, earned, sold, lent out, or held by you, and will not be held responsible for the decisions you make.