Crypto Market Weekly Outlook: Why Is Bitcoin Up and What to Watch (May 11th-15th, 2026)
Key takeaways
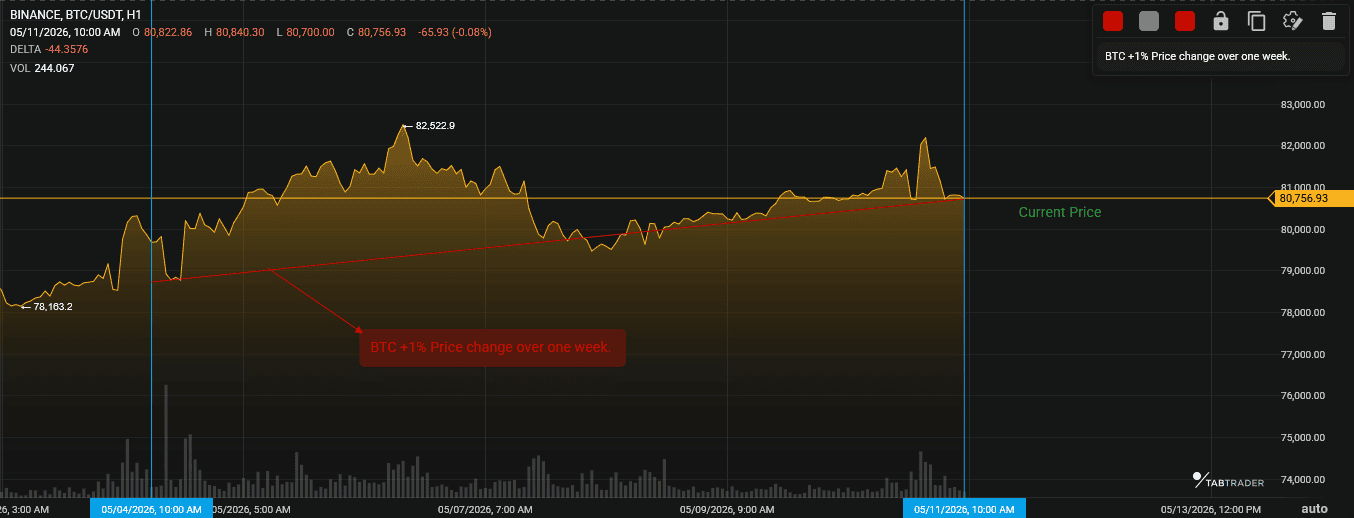
- Bitcoin has cleared a trading range that had been holding the price between roughly $75,000 and $81,000 for weeks.
- A significant event to watch this week is the April CPI release on Tuesday, May 12 at 8:30 a.m. ET. Consensus expects headline CPI at +0.6% MoM / +3.7% YoY.
- An emerging issue is that the WTI crude has re-escalated to roughly $98/barrel today after Trump rejected Iran's peace proposal. This is adding, not removing, inflation pressure.
Stay ahead of the market. Monitor every key level as it happens on TabTrader charts.
Why is Bitcoin up this week?
Bitcoin is up about 2% this week and has held above $80k. The move looks tied to steady spot demand and stronger institutional buying. Currently, the market sentiment is cautiously optimistic, leaning toward neutral to mildly bullish.
BTC price appreciation.
A few things are supporting Bitcoin right now:
- Spot Bitcoin ETFs continue to attract fresh capital, providing the market with a steady source of demand.
- Oil prices fell sharply last week on hopes of diplomacy, briefly supporting risk assets, but they have reversed higher this morning on renewed tensions, and the picture remains volatile rather than settled.
- Bitcoin has also benefited from simple market structure dynamics: once the price held above key support zones, short-term traders stopped leaning heavily bearish.
1. ETF inflows keep Bitcoin above $80K
US spot Bitcoin ETFs just posted their sixth straight week of net inflows. Data from Coinshare indicates $857.9 million in new inflows last week. That marks the longest inflow streak since August 2025 and pushes total inflows over the past six weeks above $3.4 billion.
The weekly number could have been stronger, though. Thursday and Friday both saw sizable outflows, about $277.5 million and $145.65 million, respectively, suggesting some institutions trimmed exposure ahead of key inflation data and broader macro uncertainty.
Even so, the broader trend still points to steady demand beneath the market. That matters because ETF flows have become one of Bitcoin’s cleanest liquidity signals. When inflows remain consistent, dips tend to be bought fairly quickly.
2. BTC breaks key technical resistance
Bitcoin has cleared a trading range that had been holding price between roughly $75,000 and $81,000 for weeks. The breakout shifted short-term momentum back toward buyers, with indicators such as the Bollinger Bands expanding after a long period of compression.
More importantly, BTC has continued trading above its 200-day moving average. Many institutional and systematic traders watch that level closely, so holding above it tends to reinforce bullish positioning and reduce aggressive short selling.
The move still looks controlled rather than euphoric. Volume has improved, but this does not look like a full retail-driven breakout yet. At the moment, the market feels more like a steady repricing process than a speculative frenzy.
This might interest you: What are Bollinger Bands?
Bitcoin price analysis: May 11th-May 15th, 2026
BTC/USDT/
BTC/USDT: All prices are at the time of writing and subject to change.
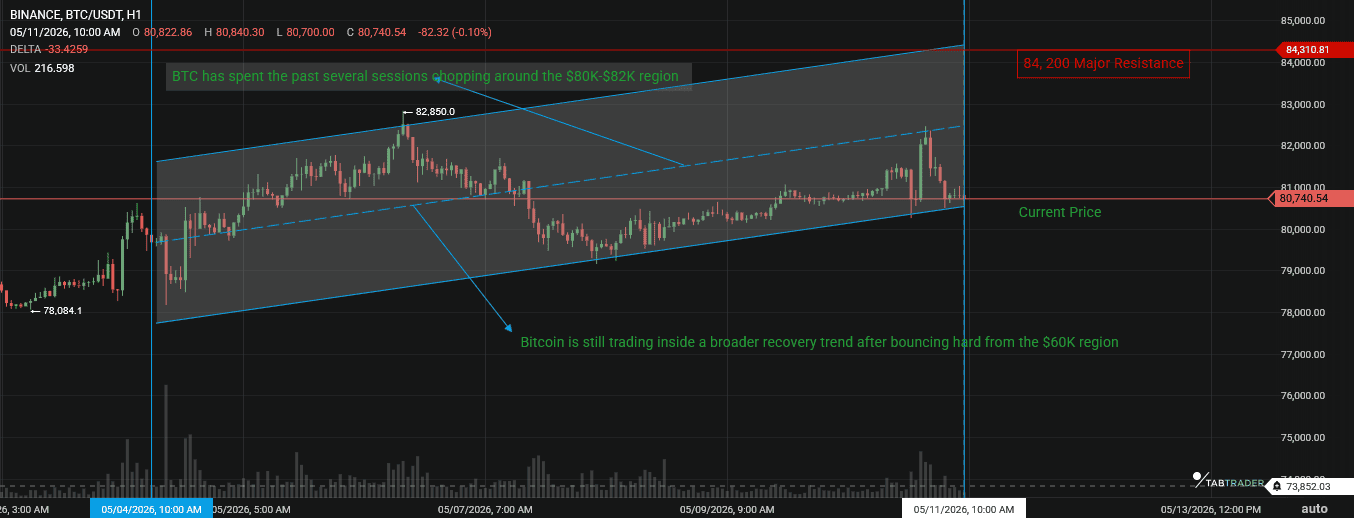
Bitcoin is still trading inside a broader recovery trend after bouncing hard from the $60K region earlier in the cycle. The structure remains constructive overall, but momentum has slowed near the $80K area, which is turning into a genuine battleground rather than a temporary pause.
On the daily chart, BTC has spent the past several sessions chopping around the $80K-$82K region without producing a convincing breakout. That zone matters because it closely aligns with the 100-day moving average, and traders tend to defend those levels aggressively during uncertain macro conditions. So far, buyers have managed to hold prices up, but they have not shown the kind of follow-through that usually kicks off a sustained expansion move.
The recent candles also show a market losing some urgency. Smaller bodies, repeated rejection wicks, and fading momentum all point toward hesitation near resistance. Right now, the short-term structure slightly favors a pullback scenario unless buyers reclaim control quickly.
Current market levels
- Current Price: Around $80,850
- Major Support: $78,500 (2026 trendline support)
- Major Resistance: $84,200 (recent local high), followed by the broader $88K region.
Key indicators
- RSI: 55: neutral territory, with room for expansion either way
- MACD: Mild bullish crossover on the 4H chart, though volume confirmation still looks weak
- Short-Term Bias: Neutral-to-bullish while BTC holds above trendline support
Chart structure right now
On the 4-hour chart, Bitcoin remains locked between an ascending trendline underneath price and overhead resistance around $80K-$83K. The structure looks more like compression than exhaustion at the moment. Buyers are still defending dips, while sellers continue fading rallies into resistance. Neither side has managed to force a resolution yet.
Ethereum price analysis: May 11-May 15, 2026
ETH/USDT.
ETH/USDT: All prices are at the time of writing and subject to change.
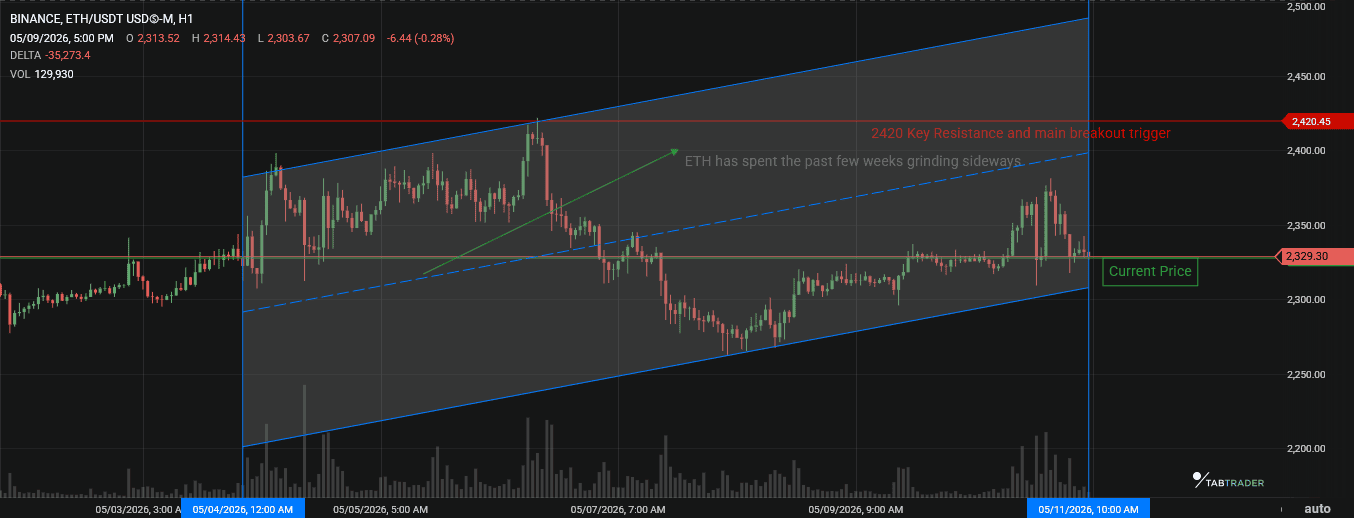
Ethereum still looks like the slower-moving part of the market right now. While Bitcoin has been absorbing most of the institutional attention, ETH has spent the past few weeks grinding sideways inside a relatively tight range between roughly $2,350 and $2,420.
The price action has not been especially impressive on the surface, but there are early signs that sentiment underneath the market is improving. Institutional flows have finally turned positive again after a long stretch of hesitation, which matters more than the short-term candles people obsess over on crypto Twitter every four minutes.
Current structure
- Price Trend: Neutral, with ETH holding between $2,350 and $2,420
- Key Resistance: $2,420 remains the main breakout trigger
- Upside Trigger: A strong daily close above resistance could force short covering and accelerate price toward the $2,700 region
Major altcoin sector overview
| Sector | Outlook and notes |
| SOL, AVAX, ADA (Layer 1s) | Bullish. Large-cap Layer 1s continue attracting rotation flows from Bitcoin profits. SOL and ADA, in particular, have outperformed BTC on the 7-day view as traders move into higher-beta majors without diving too far out on the risk curve. It’s the classic risk-on, but not too risk-on setup. |
| Legacy / Payments | Strong Bullish. XRP remains one of the strongest large-cap performers, trading around the center of renewed institutional speculation and accumulation chatter. XLM has also benefited from renewed interest in payment-focused networks as traders look for lagging majors with liquidity and recognizable narratives. |
| DeFi | Neutral. DeFi activity looks relatively flat for now. Total value locked (TVL) has stabilized, but there is no major expansion in participation yet. Traders currently seem more interested in directional exposure through Layer 1s and Bitcoin rather than rotating heavily into protocol governance tokens. |
Altcoin sector summary
The market rotation is becoming more selective.
Right now, capital is flowing primarily into established large-cap altcoins, especially Layer 1 networks and payment-focused assets like XRP, while more speculative sectors remain under pressure. Traders still want crypto exposure, but the appetite for high-risk moonshot positioning has cooled noticeably ahead of key inflation data and broader macro uncertainty.
That distinction matters. Earlier in bullish cycles, almost everything tends to rally together. This market looks more defensive and concentrated. Money is moving, but slowly.
For the moment, the quality beta trade is leading: Bitcoin first, large-cap alts second, speculative narratives somewhere far behind, trying to remember what optimism felt like.
Market metrics and sentiment
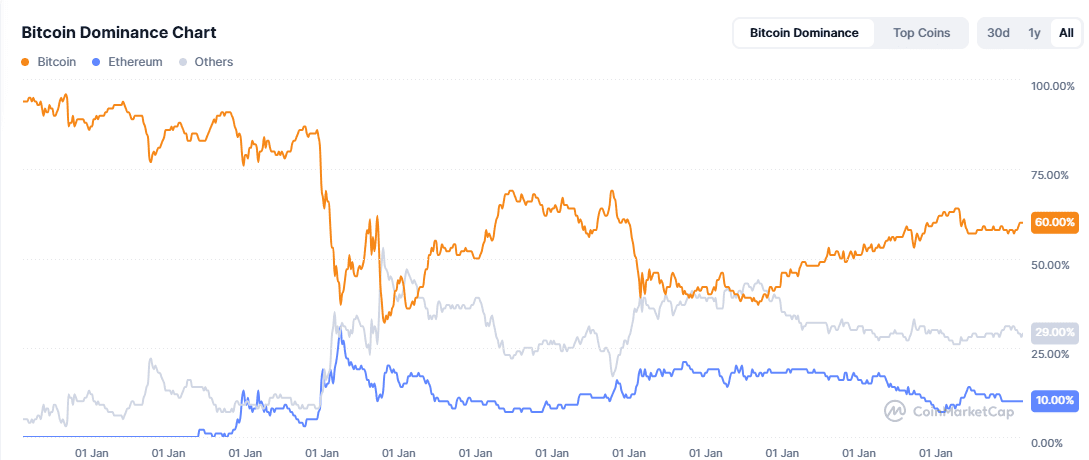
Image source: CMC.
Key crypto market events to watch this week ( May 11th-May 15th, 2026)
- May 12 (Tuesday): US CPI Report (The biggest volatility driver for the week).
- Ongoing: Middle East de-escalation talks (Impacts the Risk-Off narrative).
Possible market scenarios for the week
This week’s scenarios hinge on the May 12th CPI release.
Bullish scenario
A softer-than-expected CPI reading gives markets room to lean risk-on again. In that setup, Bitcoin reclaims the $82,500 region and forces short sellers to quickly unwind their positions, opening a path toward the $88,000 area.
The key detail here is momentum confirmation. If BTC clears resistance with strong spot demand rather than thin, leverage-driven buying, the move becomes much harder to fade.
Neutral / range scenario
Bitcoin continues trading between roughly $78,000 and $82,000 as markets await additional clarity from the new Fed leadership and more inflation data. This would likely create the healthiest environment for selective altcoin strength.
Bearish scenario
A hotter-than-expected CPI print, particularly if core CPI breaks above 0.4% MoM, which consensus pegs at 3.7% YoY headline, would likely pressure risk assets across the board.
Note that a shelter-driven beat caused by the OER catch-up distortion may not trigger the same market reaction as a broad-based inflation surprise, so context will matter enormously in the first hour after the print. A Bitcoin break of the $78,000 support zone could trigger a swift move toward the $72,000–$74,000 demand area.
Bottom line
The CPI print on Tuesday will dictate the trend for the rest of May. Going into it, the macro picture is messier than last week, oil has re-escalated, the Fed is in a leadership transition, and CPI itself may be distorted by a one-time shelter adjustment. Read the number carefully before reacting.
The smart-money positioning in ETH and XRP remains a notable signal. Institutional ETF flows have been consistently positive for six straight weeks, creating a structural demand floor beneath BTC around the $80K level. Keep stop losses tight below $78K for BTC and look to enter ETH or SOL on any CPI-induced fake-out dips.
FAQs
1. Why does a non-crypto event like the CPI report affect my Bitcoin?
In 2026, Bitcoin is no longer an isolated asset; it is a major component of global institutional portfolios. The Consumer Price Index (CPI) measures inflation.
The Federal Reserve may keep interest rates high to cool the economy. Higher interest rates make the Dollar expensive and risky assets like BTC less attractive.
2. Should I be buying Altcoins now or just sticking to Bitcoin?
That depends on your risk tolerance.
At the moment, large-cap altcoins appear healthier than speculative smaller-cap sectors.
3. What is the Powell – Warsh transition and why does it matter for crypto?
Jerome Powell’s term as Federal Reserve Chair officially ends May 15, 2026. Kevin Warsh is expected to chair the June FOMC meeting. Warsh has previously signaled support for:
- A smaller Fed balance sheet
- Less dependence on the Fed “dot plot”
- More discretionary policy flexibility
Markets are still adjusting expectations around what this means for future rate policy and liquidity conditions.
Spot key levels in real time, then trade smarter live on TabTrader.
Important Note: TabTrader does not provide investment, tax, or legal advice, and you are solely responsible for determining whether any financial transaction strategy or related transaction is appropriate for you based on your personal investment objectives, economic circumstances, and risk tolerance. Tab Trader may provide information that includes but is not limited to blog posts, articles, podcasts, tutorials, and videos. The information contained therein does not constitute investment advice, financial advice, trading advice, or any other sort of advice, and you should not treat any of the content as such. TabTrader does not recommend that any digital asset should be bought, earned, sold, lent out, or held by you, and will not be held responsible for the decisions you make.