Crypto Chart of the Week: Bitcoin slips below $68K as Geopolitics Tension Weighs on Markets
Here are main factors moving the market this week:
- Ongoing tensions in the middle-east are creating uncertainty and strengthening the dollar.
- The $14.16B Deribit options expiry contributed to short-term price pinning and range-bound trading.
- Bitcoin ETF flows have turned net positive this month ending a three-month streak of outflows.
- XRP’s classification as a digital commodity on March 27 is a major long-term fundamental catalyst.
Bitcoin spent most of the week caught between two opposing forces trying to pull a clear direction. It briefly pushed above $70,000, then settled back below that level as risk-off sentiment and a major options expiry kept the price pinned in a narrow range.
The bigger overhang is the SEC’s March 27 deadline on the spot XRP ETF. This decision has been sitting in the background all week, and it shows. If the ETF is approved, it would mark a clear shift in how the SEC approaches crypto, especially following the recent momentum of the CLARITY Act.
Looking at the bigger picture, this week was less dramatic than the headlines made it seem. The $14.16 billion options expiry on Deribit was important, and the Iran–US tensions pushed the dollar to a 10-month high, which usually pressures risk assets. Still, the market stayed fairly stable overall.
To reinforce this point, Bitcoin ETF flows have quietly turned positive again, wiping out the year-to-date deficit with about $1.5 billion in net inflows this month. Meanwhile, retail sentiment remains in fear, which usually shows up as low participation rather than aggressive selling.
This creates a split market. Institutional investors are steady and sometimes opportunistic, while retail investors are mostly staying out. Unless this changes, prices will probably keep moving slowly instead of making big moves.
Bitcoin chart analysis
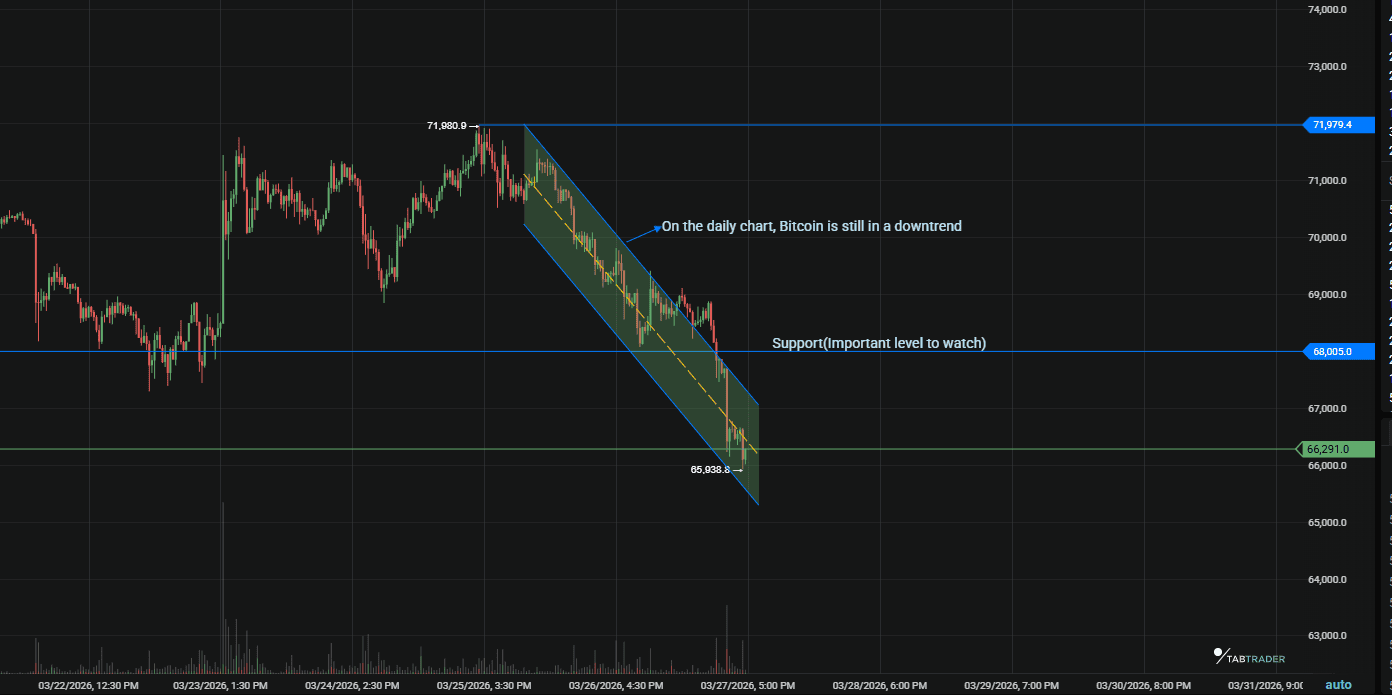
Bitcoin opened the week near $67,400–$68,000, climbed to roughly $71,200–$72,000 mid-week, and drifted back toward the high $68,000s to low $66,000s by week’s end. Daily price action remained range-bound with limited follow-through.
Looking at the TabTrader daily chart, the overall pattern hasn’t changed much. The price is still moving in the same downward channel that started after the February drop. However, this week’s higher low near $65,200 is notable. While it doesn’t confirm a reversal, it suggests the market is tightening. The data points more to a pennant or a larger base forming, rather than a straight move down.
BTC/USDT
*All prices are at time of writing and subject to change. Refresh charts on TabTrader for live data.
Bitcoin weekly technical analysis
Resistance at around $71,000 is still limiting upward moves. Every time the price approached this level, it faced selling pressure, partly because of options expiry, which stopped rallies from lasting.
Key support sits around $68,000, though it has been tested multiple times and briefly broken on Friday.
Ethereum weekly technical analysis
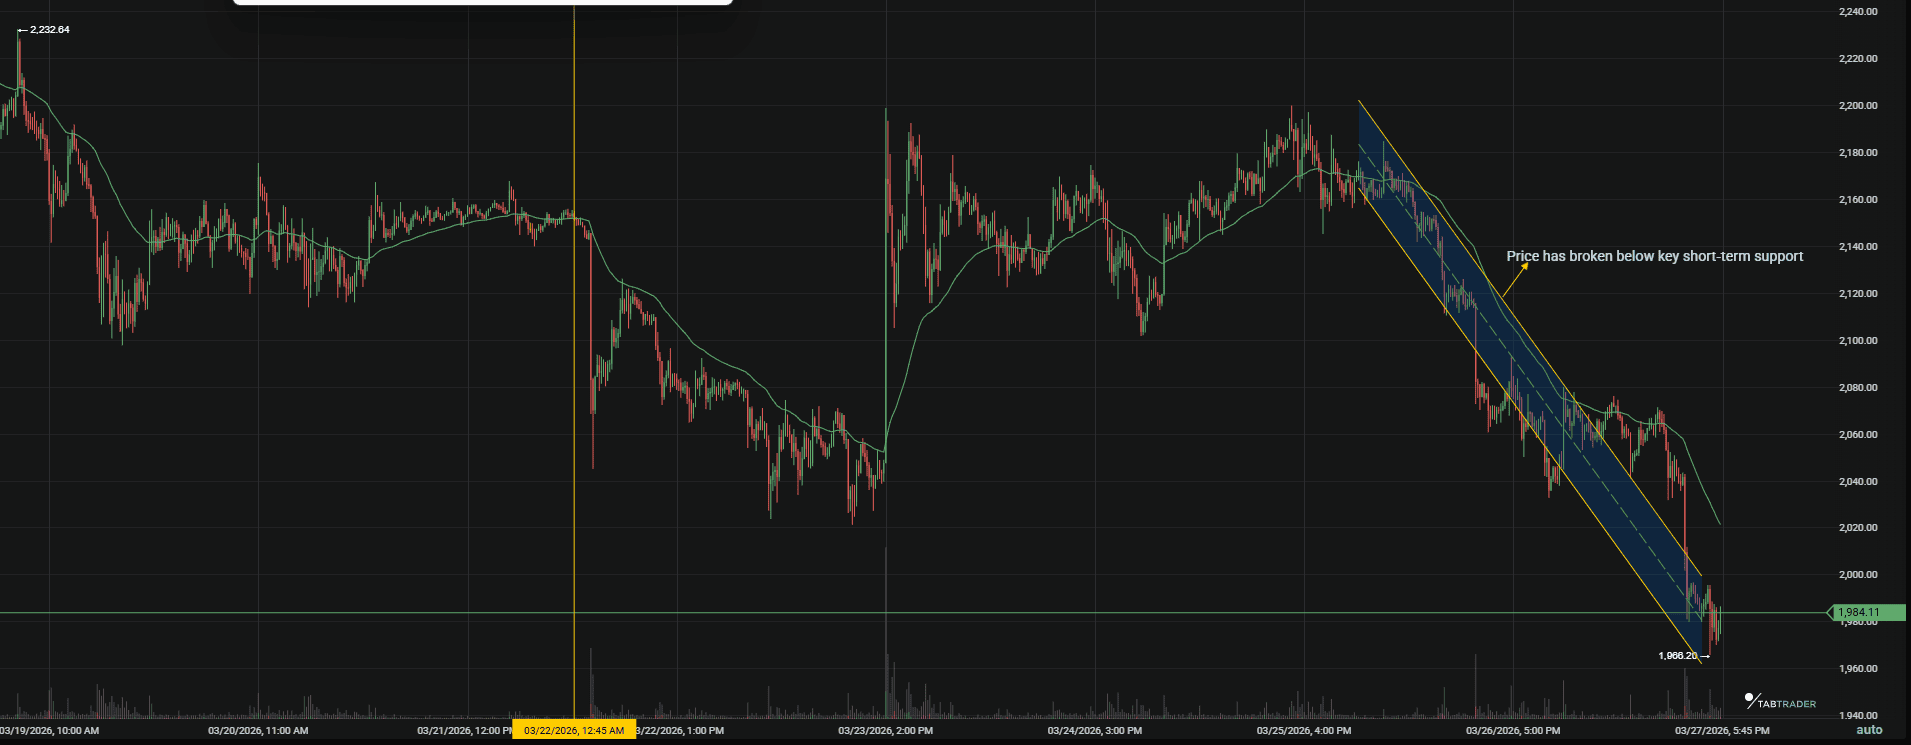
Ethereum is still struggling to gain ground. The ETH/BTC ratio is still sitting near multi-year lows, which tells the story better than the USD chart. According to our analysis, capital just isn’t rotating into ETH right now.
ETH/USDT
The Prague upgrade is progressing as planned on testnets, but it hasn’t helped the price yet. Institutional ETF flows aren’t supporting ETH either. About $123 million in outflows has limited any real gains, and you can see this hesitation in how the price reacts to small rallies.
$2,060 is the key level to watch on the downside. The price has held above it so far, but it’s been tested several times, so a clear break wouldn’t be surprising. If that happens, $1,900 could be reached quickly, since there isn’t much support in between.
Altcoin snapshot
| Asset | Current price | Weekly range | Note |
| ETH | ~$1973 | -7.12% | Institutional outflow and macro risk-off. spot Ethereum ETFs recorded their seventh consecutive day of net outflows |
| Solana (SOL) | ~$82.91 | -6.49% | Holding steady following the launch of the Solana Developer Platform and new AI integrations. |
| XRP | ~$1.33 | -6.91% | Volatility spiked despite its new commodity status. |
| Cardano (ADA) | ~$0.2477 | -6.75% | Technical compression as the network focuses on governance and regional expansion. |
| Polkadot (DOT) | ~$1.27 | -15.88% | Drop aligns with a broad crypto decline |
*All prices are at time of writing and subject to change. Refresh charts on TabTrader for live data.
What to expect next week
Now that the $14.16 billion options expiry is over, the artificial pinning effect should fade. This could allow for wider price ranges and quicker moves.
Next week’s direction depends on two things: whether $68,000 stays as support, and how the market reacts to the SEC’s XRP ETF decision.
Retail investors are still cautious, with low participation, while institutional flows have been selectively positive in March. Until more retail investors return, expect slow movement with occasional sharp breakouts.
Bottomline
The week points to compression. This means prices are boxed in, volatility is muted, and much of the movement didn’t go anywhere. That setup usually doesn’t last.
With the $14B options expiry now behind us, that artificial pin is gone. Price isn’t being pulled toward a specific strike anymore, which removes a big source of friction. Markets tend to move more freely once that kind of positioning clears out.
So heading into March 28 – April 3, the expectation shifts toward expansion. Not necessarily directionally bullish or bearish right away. According to our analysis, there could be wider ranges, faster moves, and less of the slow grind we just saw.
Important Note: TabTrader does not provide investment, tax, or legal advice, and you are solely responsible for determining whether any financial transaction strategy or related transaction is appropriate for you based on your personal investment objectives, economic circumstances, and risk tolerance. Tab Trader may provide information that includes but is not limited to blog posts, articles, podcasts, tutorials, and videos. The information contained therein does not constitute investment advice, financial advice, trading advice, or any other sort of advice, and you should not treat any of the content as such. TabTrader does not recommend that any digital asset should be bought, earned, sold, lent out, or held by you, and will not be held responsible for the decisions you make.