Crypto Chart of the Week: Bitcoin’s First Weekly Gain Since January

What moved the Crypto market this week?
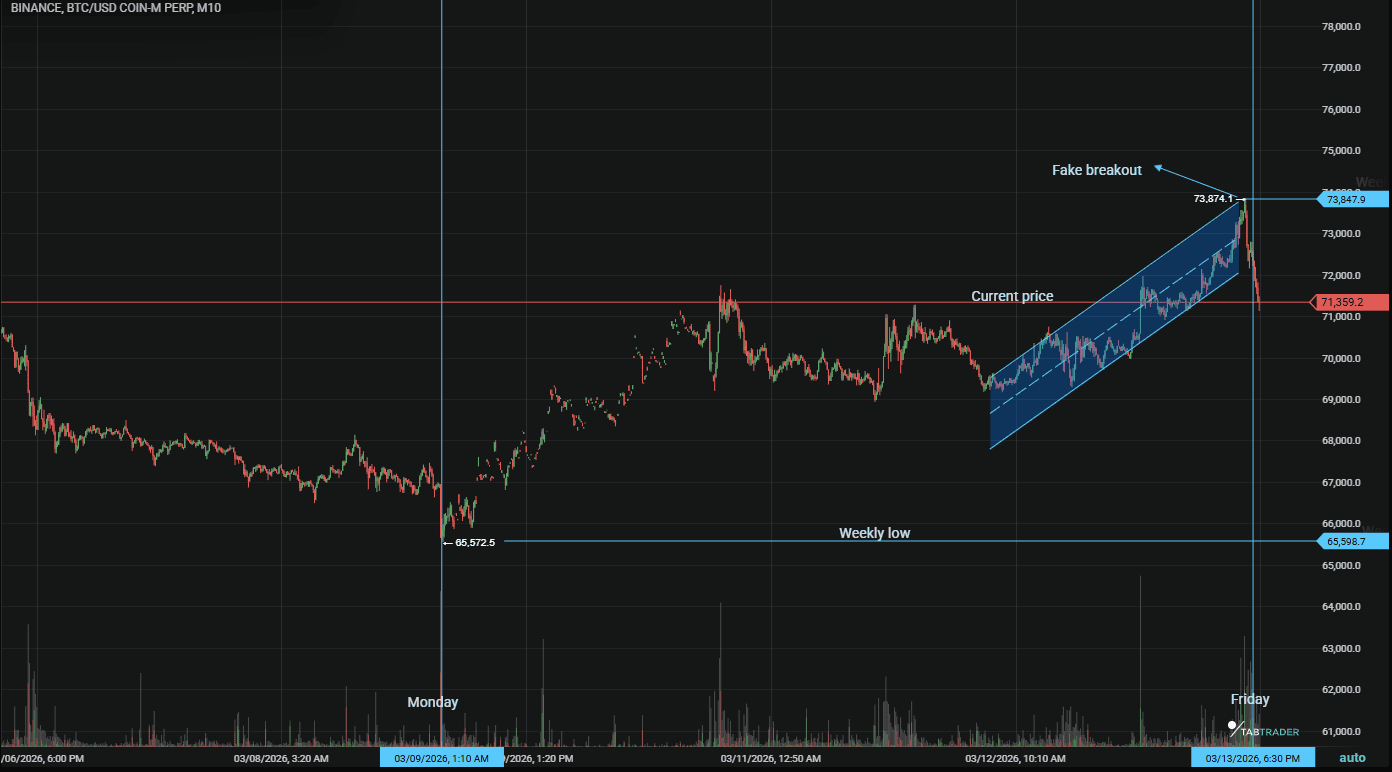
Bitcoin opened the week near $65,970, reeling from a previous rejection at $74K. However, the crypto market outlook shifted following the March 11 CPI release. Headline inflation landed at 2.4%, the lowest since May 2025, providing the macro relief needed for a risk-on pivot.
While BTC briefly dipped to $69K post-data, it recovered sharply to trade at $73,842 by Friday. This recovery is underpinned by two major catalysts:
- Institutional re-entry: Spot Bitcoin ETFs saw $568M in net inflows this week, marking two consecutive weeks of positive momentum.
- Corporate conviction: Strategy purchased over $1B in BTC at an average price of $70,946, bringing their total holdings to 738,731 BTC.
- BTC dominance held 57–58.7%. Altcoins broadly tracked BTC but didn’t break out. No rotation signal yet.
Bitcoin chart analysis
Bitcoin is posting its first weekly gain since early January, characterized by a 9–12% bounce, compressed volatility, and headlines declaring sentiment may be shifting. Historically, such moves mark the initial phase of sustained recovery, though caution is warranted.
The structural context matters here. Bitcoin hit its all-time high of $126,296 on October 6, 2025. By February 6, 2026, it had fallen to $60,001, a peak-to-trough decline of 52.5%. That drawdown already exceeds the mid-cycle corrections of 2021.
This context is not a prediction. Current on-chain data such as compressed volatility, coins leaving exchanges, and neutral funding rates, suggest accumulation. However, the first bounces in prior cycles looked similar. What sets this cycle apart remains uncertain.
The variable that would genuinely distinguish this recovery from prior false starts: sustained ETF net inflows above $1B per week for four or more consecutive weeks. That pace would signal institutional conviction, not just tactical dip-buying.
Last week’s $568M, following $787M the week prior, is directionally right but not yet at that threshold. Strategy’s $1B purchase adds to the institutional picture, but one corporate buyer is not the same as broad ETF demand. Closely watching weekly ETF flows will help gauge the strength and depth of institutional conviction.
Bitcoin weekly technical analysis
BTC broke above the 200-day EMA (~$72,600–$73,000) for the first time since February, marking its strongest recovery attempt yet.
All prices are at time of writing and subject to change. Refresh charts on TabTrader for live data.
The daily close tonight matters. A close at or above $72,600 for the first time since February 10 would be the first technical confirmation of a trend shift. Until then, this week’s move is an impressive rally inside a downtrend, not a confirmed reversal.
Ethereum Chart of the Week: ETH/USDT
Ethereum has outperformed Bitcoin this week on a percentage basis (+10.9% vs +9.1%). ETH has now defended the $2,000 support zone for the third consecutive test since January, a sign of sustained demand at that level.
The Prague upgrade (Pectra) continues as a technical catalyst. ETH ETF inflows also picked up, recording $57M in a recent daily session. ETH/BTC ratio remains near multi-year lows, meaning Ethereum has underperformed Bitcoin on a relative basis for months. That ratio needs to reverse before altcoin season becomes a realistic conversation.
Altcoin Snapshot
| Asset | Price | Wk Change | Market Cap | Note |
| ETH | $2,148–$2,200 | +10-11% | $259B | Prague upgrade; $2K defended 3x |
| XRP | $1.41 | +2.5% | $86B | Flat week; ETF outflows offset inflows |
| SOL | ~$83 | +3.8% | ~$39B | Lagging; fear & greed at 12 for SOL |
| BNB | ~$640 | +3.5% | ~$93B | Quiet outperformer, steady bid |
| DOGE | ~$0.17 | +2.1% | ~$25B | No standalone catalyst; follows BTC |
No altcoin is outperforming BTC meaningfully this week. That is the definition of a Bitcoin-dominant regime. For altcoins to break out, BTC dominance needs to stop rising, and ideally fall from 58%+ toward 54% or below.
Bottom line
Bitcoin is at $73,842, pressing the 200-day EMA for the first time since February. This is its first weekly green close since January. ETF inflows totalled $568M last week. Strategy added $1B more at $70,946. On-chain conditions are the healthiest they’ve been in months. The macro window, in-line CPI, FOMC next week, is as good as it has been since October 2025.
This setup is the strongest since late 2025, with the 200-day EMA breach a major technical milestone. Sustained $1B+ weekly ETF inflows would solidify conviction and potentially drive past $74K resistance. Risks include fragile underlying demand, competition from tokenized assets, and macro reversals.
Ready to trade the volatility?
Connect to over 20 exchanges from a single dashboard, including Binance and Kraken.

Set your alerts on TabTrader Now.
Important Note: TabTrader does not provide investment, tax, or legal advice, and you are solely responsible for determining whether any financial transaction strategy or related transaction is appropriate for you based on your personal investment objectives, economic circumstances, and risk tolerance. Tab Trader may provide information that includes but is not limited to blog posts, articles, podcasts, tutorials, and videos. The information contained therein does not constitute investment advice, financial advice, trading advice, or any other sort of advice, and you should not treat any of the content as such. TabTrader does not recommend that any digital asset should be bought, earned, sold, lent out, or held by you, and will not be held responsible for the decisions you make.