Crypto Market Weekly Outlook: BTC Hits $74K Breakthrough Amid Fed Uncertainty
Key takeaway
- The crypto market enters mid-March, diverging from equities. While traditional stocks hesitate amid macro pressures, Bitcoin and Ethereum chart distinct paths, driven by supply milestones and shifting capital flows. BTC flipped $74,000 into support.
Market overview
As of March 17, 2026, the crypto market stands out amid rising energy prices, geopolitical tensions, and a cautious Federal Reserve in traditional markets.
Crypto outperformed over the weekend, with Bitcoin and top assets rising as equities stalled, a divergence that rarely happens in 2026 and draws trader interest.
The mood is cautiously constructive. Markets are climbing a wall of worry, but crypto shows little hesitation.
Key macro drivers
The week’s main macro event is the Federal Reserve’s March 17–18 FOMC meeting. Rate markets expect the Fed to hold steady at 3.5%–5.5%.
That expectation hasn’t changed much since the latest inflation data. The most recent CPI print came in at 2.4% year-over-year, roughly in line with forecasts. Inflation isn’t accelerating, but it isn’t fading quickly either. The higher-for-longer policy remains the baseline.
In crypto, energy markets act as a wild card. Oil nears $100 per barrel, fueled by Middle East tension and concerns over the Strait of Hormuz, a key shipping route.
Interruptions would quickly impact global markets as energy prices and inflation expectations react.
Bitcoin rallied amid intensifying geopolitical headlines, some see this as capital moving toward scarce, politically neutral assets. Correlation with equities has loosened for now.
Risk sentiment has shifted. Institutions warn of slower global growth, yet crypto markets act as if liquidity is quietly rotating.
The market is balancing fragile macro conditions and crypto’s potential. Traders monitor which narrative will prevail.
Bitcoin (BTC) analysis
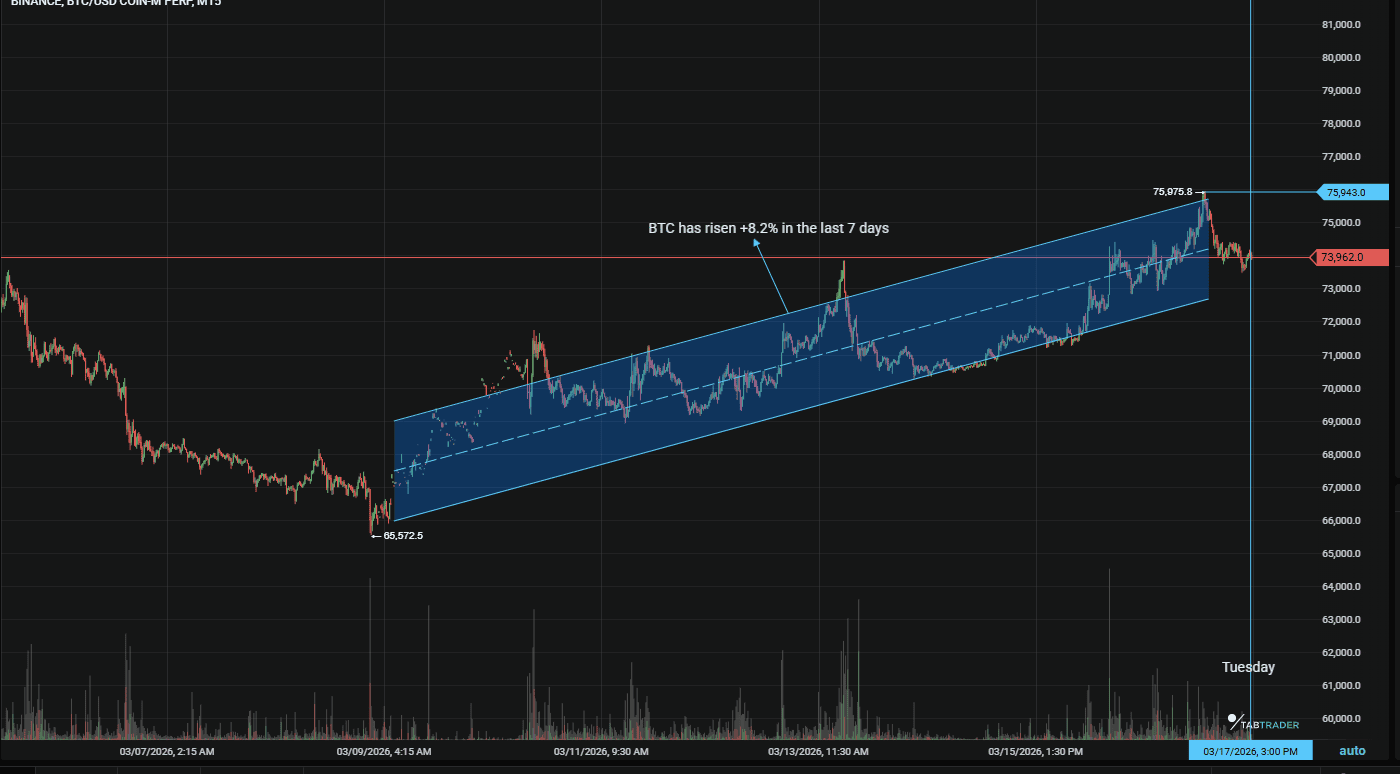
Bitcoin leads again this week having risen 7.5% over the course of the week. Additionally, the 20 millionth BTC was mined six days ago, highlighting long-term supply tightness. Such milestones don’t directly move prices but remind markets of scarcity.
According to our technical analysis, BTC is sitting in a fairly balanced setup. Momentum indicators are neutral enough to allow movement in either direction, which fits with the consolidation traders have been watching over the past several sessions.
Liquidity is steady, and institutional interest continues. Large desks issue aggressive year-end projections, and institutional caution has noticeably declined.
At the moment, price action supports that interpretation. Bitcoin pushed through the long-watched $74,000 psychological level after roughly a week of steady upside. The move wasn’t explosive but the breakout was clean.
BTC prices are at time of writing and subject to change. Refresh charts on TabTrader for live data.
All prices are at time of writing and subject to change. Refresh charts on TabTrader for live data.
Key levels
- Resistance: $74,500 (immediate), $80,000 (macro target if momentum continues)
- Support: $72,000 (former resistance turned support), $68,000 (near the 50-day EMA)
Technical indicators
- RSI: Around 60 on the daily chart. Momentum is strong but not fully stretched yet. Markets can stay in that zone longer than people expect, especially during strong trends.
- MACD: Bullish crossover confirmed on the 4-hour chart, reinforcing the short-term momentum.
Chart note
The 4-hour chart shows a fairly clean breakout of an ascending triangle. More importantly, volume expanded alongside the move above $74K. When price breaks resistance without volume, it usually retraces quickly. That didn’t happen here, which suggests the move was driven by real demand rather than a quick liquidation spike.
Ethereum (ETH)
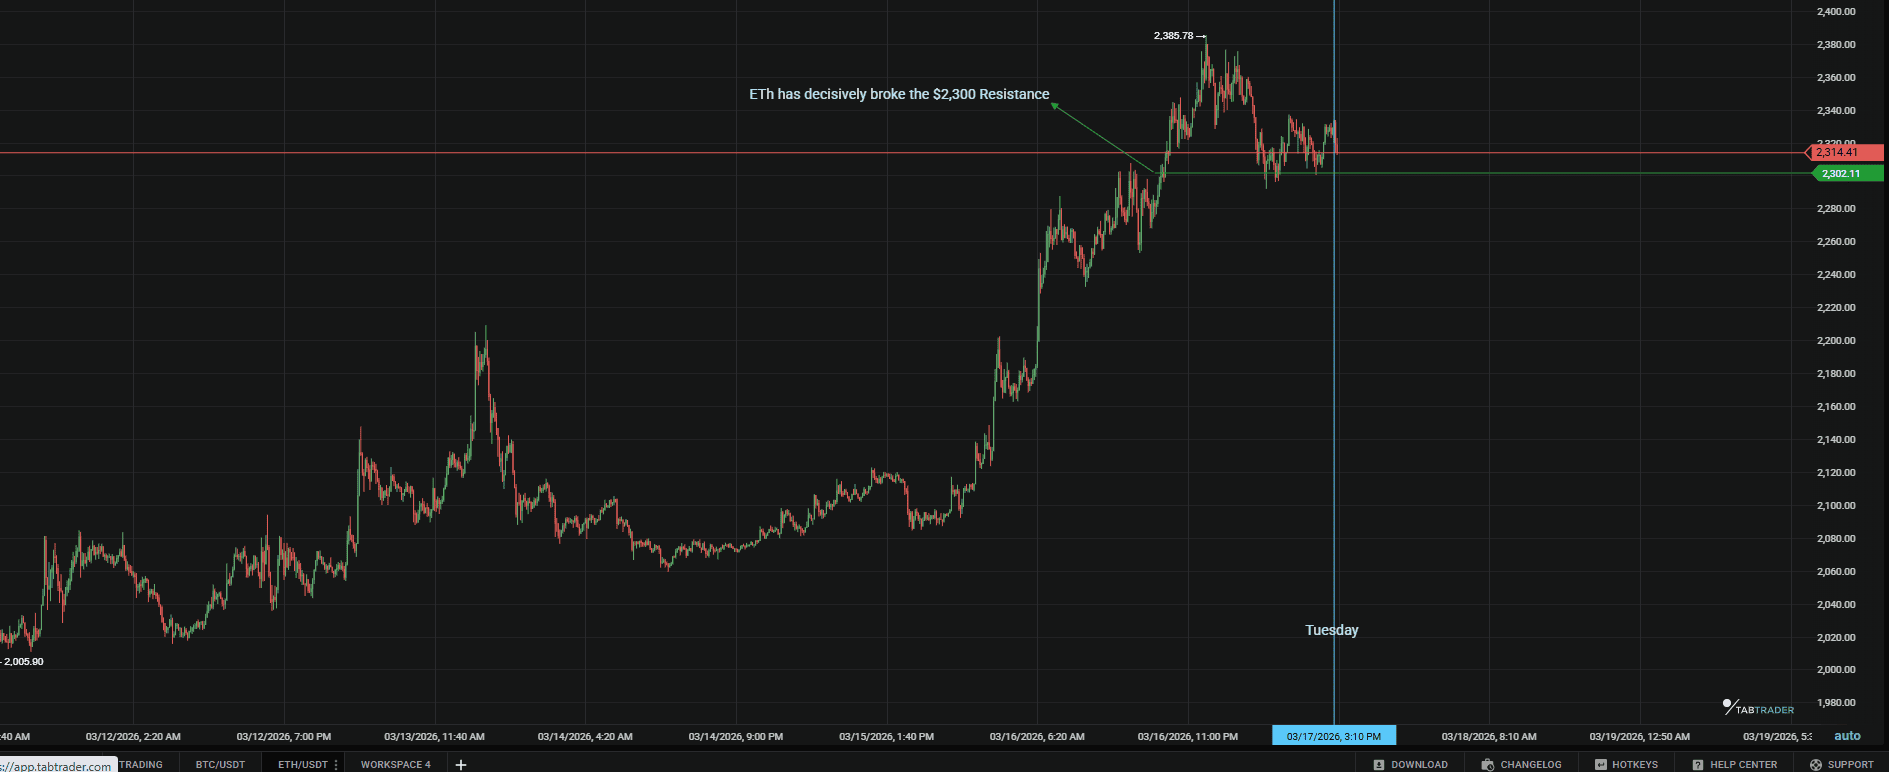
After a few weeks lagging behind other assets, Ethereum has shifted into the role of short-term momentum leader.
ETH has outpaced Bitcoin recently, signaling early capital rotation down the risk curve. Traders take profits on BTC and redeploy into large-cap altcoins, starting with Ethereum.
The ETH/BTC pair is rising, suggesting a shift back to the broader ecosystem narrative. Price action, however, is running into a familiar obstacle.
ETH prices are at time of writing and subject to change. Refresh charts on TabTrader for live data.
All prices are at time of writing and subject to change. Refresh charts on TabTrader for live data.
ETH faces heavy resistance around $2,250, a level that has been rejected multiple times. Traders await whether buyers will absorb the supply there.
Key zones
- Support: $2,100: The level buyers have consistently defended during recent pullbacks.
- Resistance: $2,500: The next major breakout point.
A clean move through $2,500 would likely change the market tone fairly quickly. Once that level goes, there isn’t much historical resistance until the mid-$3,000 range. For now, though, Ethereum still needs to finish the job at $2,250. The market has a habit of stalling at obvious resistance before the real move begins.
Major altcoin sector overview
Layer 1 tokens
Solana leads Layer 1s, up over 4% today and outperforming Bitcoin. This usually signals renewed interest in infrastructure, not just speculation.
DeFi
Activity is gradually improving, but the sector still feels restrained. Regulatory noise out of the UK, involving figures like Boris Johnson and comments from Brian Armstrong, has made some investors cautious. The capital is there, just not rushing in yet.
Gaming
Interest in metaverse tokens remains muted. Projects like Axie Infinity and The Sandbox haven’t attracted the same momentum as infrastructure or AI plays. Capital is clearly prioritizing other themes for now.
Altcoin sector summary
Infrastructure and AI protocols get the most attention. Bitcoin remains the anchor, but higher-beta gains show elsewhere.
Currently, Solana and AI-adjacent tokens attract most speculative capital, though this can shift quickly as traders seek momentum.
Market metrics and sentiment
- Fear & Greed Index: 39, firmly in Fear territory. That reading is a little unusual, given that Bitcoin is trading around the mid-$70K range. In previous cycles, sentiment usually flips to greed much sooner once prices approach new highs.
- BTC Dominance: 58.6%, Capital is still consolidating in Bitcoin, while risk appetite remains muted.
What could move the crypto market this week?
- Mar 17-18: FOMC Meeting and rate decision. FOMC outcome and Powell's tone—hawkish pulls back; neutral/dovish extends rally.
- Mar 18: Fed Chair Powell Press Conference. His tone on inflation will dictate whether the rally continues or stalls.
- Ongoing: EthCC Cannes Pre-buzz. Developers are beginning to gather in France; expect leaked roadmap updates for Ethereum L2s.
Possible scenarios for the coming week
Bullish scenario
Bitcoin maintains support above $74,000 through the FOMC announcement and the press conference that follows. Powell sticks to the familiar script: inflation improving slowly, policy remaining data-dependent, no urgency to tighten further.
That kind of messaging usually keeps risk assets comfortable. In that case, momentum could carry Bitcoin toward the $80,000–$85,000 region as traders lean back into the breakout.
Neutral scenario
BTC slips back below $74K and settles into a short consolidation phase. The market drifts between $71,000 and $73,500 as traders digest macro signals and await the next catalyst.
A pause after a sharp rally isn’t unusual; markets often compress before the next move.
Bearish scenario
The outlier scenario would be a hawkish surprise from the Fed. Particularly, any renewed discussion of additional rate hikes or a more aggressive stance on inflation.
If that happens, risk assets could react quickly. A decisive break below $68,000 would likely shift the market's tone and open the door to a deeper retracement toward $62,000.
Though unlikely, Fed meetings often produce volatility even when expectations seem anchored. Traders prepare for surprises.
FAQs
What is the Bitcoin price outlook for March 2026?
The Bitcoin price outlook for March 2026 depends heavily on macroeconomic conditions, especially the Federal Reserve’s policy decisions. If Bitcoin holds above the $72,000 support level during the Fed meeting, analysts expect a bullish move toward the $80,000–$85,000 range. However, failure to maintain this level could lead to short-term consolidation.
How do energy prices affect Bitcoin?
Energy prices, particularly oil, influence broader financial markets by shaping inflation expectations. Rising oil prices tend to pressure equities due to higher costs and tighter monetary policy.
In contrast, Bitcoin is often viewed as a scarce, politically neutral asset, meaning:
- It is less directly impacted by inflation fears
- It may attract investors seeking alternatives to traditional markets
- It can act as a hedge during macroeconomic uncertainty
Is Ethereum a good buy at $2,250?
At $2,250, Ethereum is facing a key resistance level, making it a critical decision zone for traders.
- A breakout above $2,500 would signal strong bullish momentum and a potential buying opportunity
- Failure to break resistance may result in sideways movement or a pullback
For confirmation, traders typically wait for high trading volume and sustained price action above resistance before entering positions.
Bottom line: All Eyes on Jerome Powell
We expect the central variable this week to be the Federal Reserve. Accordingly, all attention is on Wednesday’s remarks from Jerome Powell. Markets already expect the Fed to hold rates steady, so traders are really parsing tone. That messaging will likely determine whether the current rally continues or pauses.
If Bitcoin stabilizes above $72,000 after the FOMC press conference, the broader uptrend remains intact, and the recent breakout looks more durable. In that case, the market is likely to enter the next leg of the cycle rather than slip back into consolidation.
If that level fails, the rally probably needs more time to reset before making another serious attempt higher.
Important Note: TabTrader does not provide investment, tax, or legal advice, and you are solely responsible for determining whether any financial transaction strategy or related transaction is appropriate for you based on your personal investment objectives, economic circumstances, and risk tolerance. Tab Trader may provide information that includes but is not limited to blog posts, articles, podcasts, tutorials, and videos. The information contained therein does not constitute investment advice, financial advice, trading advice, or any other sort of advice, and you should not treat any of the content as such. TabTrader does not recommend that any digital asset should be bought, earned, sold, lent out, or held by you, and will not be held responsible for the decisions you make.