Awesome Oscillator
The Awesome Oscillator (AO) is an indicator used to measure market momentum. AO basically determines whether the current trend is bullish or bearish, or whether a trader should expect a possible reversal.
The indicator's histogram consists of slopes turning from red to green and vice versa. Because of its nature as an oscillator, AO is designed to have values that fluctuate above and below the zero line.
When the price makes a new high or new low, AO should mirror this process. If the indicator does not support price action, this might signal a trend reversal.
If AO crosses above the zero line, this indicates a bullish trend, but if it crosses below the zero line, this suggests bearish momentum.
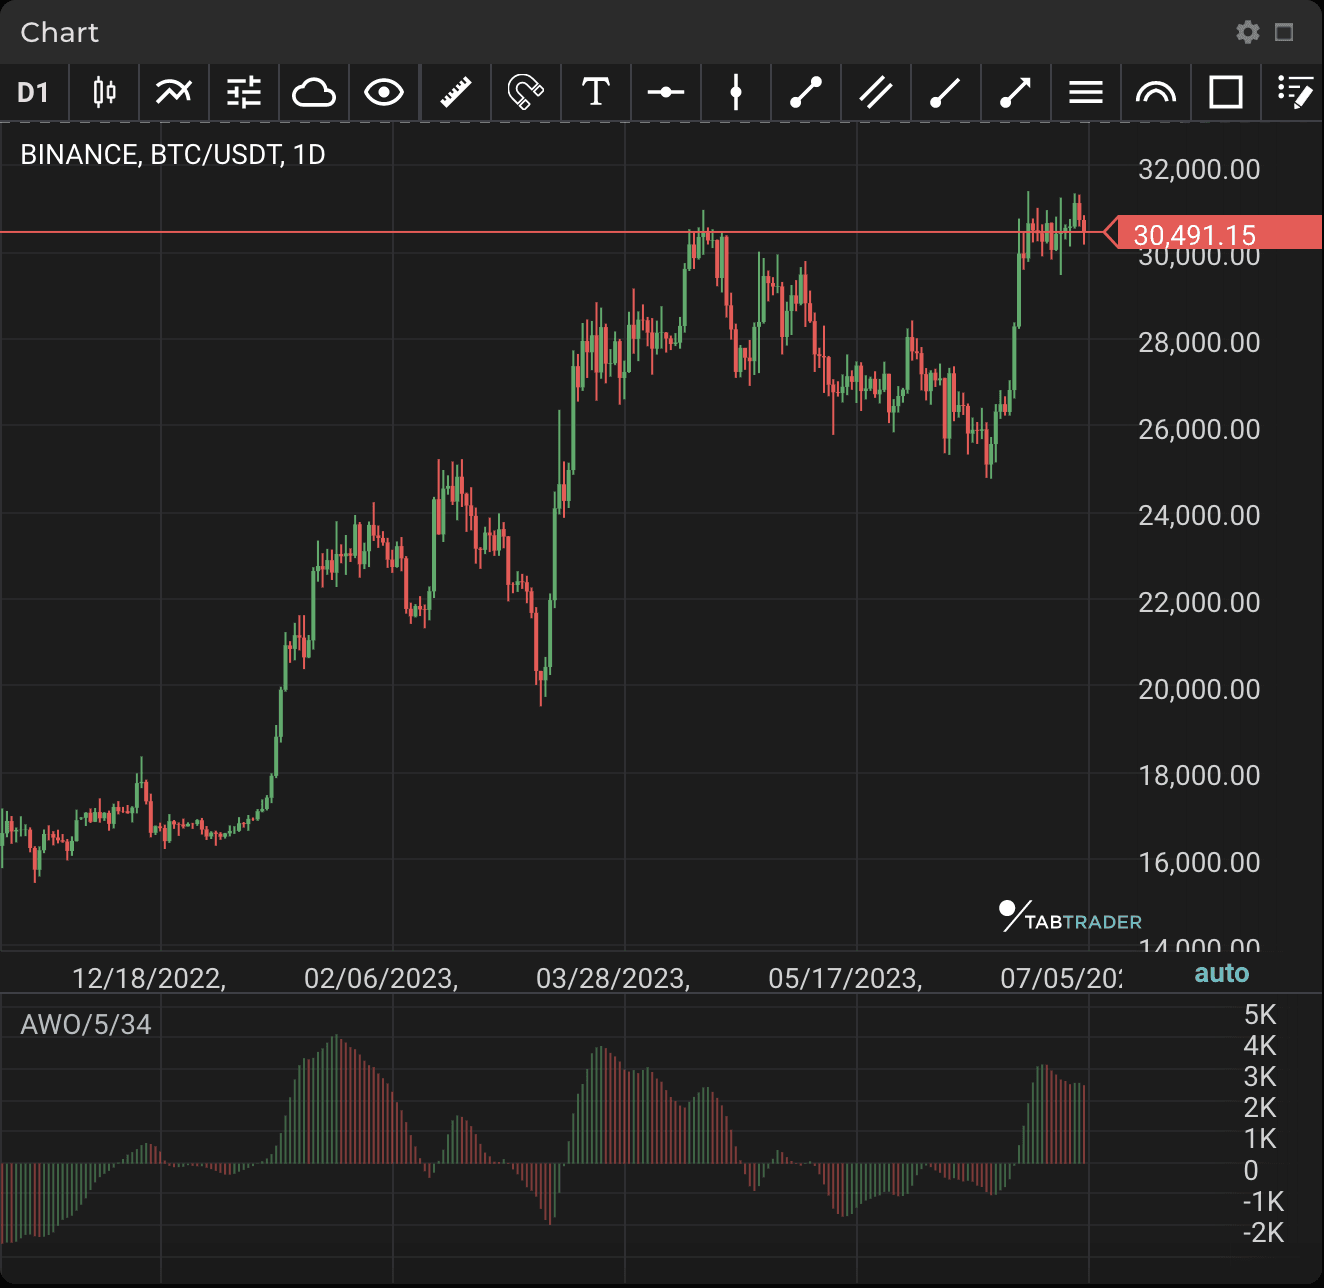
AWO
Some basic trading strategies using AO include zero-line crossover, twin peaks, the saucer and divergence.
Zero-line crossover: when AO crosses above the zero line, short-term momentum is rising faster than long-term momentum. This can present a bullish buying opportunity. By contrast, when AO crosses below the zero line, short-term momentum is now falling faster than long-term momentum. This can present a bearish selling opportunity.
Twin peaks: this is a method which considers the differences between two peaks on the same side of the zero line. Note that the trough between the two peaks must remain below the zero line throughout. A bullish twin peaks setup occurs when there are two peaks below the zero line: the second peak is higher than the first and followed by a green bar.
The saucer: When AO is above 0 and there are two consecutive red histograms, the second red histogram being shorter than the first and the third histogram green, these are the conditions for a trader to buy at the fourth candlestick open. When AO is below 0 and there are two consecutive green histograms, the second shorter than the first and followed by a third red histogram, these are conditions for traders to sell at the fourth candlestick open.
Divergence: AO divergence signals a probable correction or even a reversal of the current trend. A buy divergence signal occurs when price forms a low below the previous one but the AO low is above the previous one. After price reverses upwards, traders open a sell position with a stop-loss behind the local low. A sell divergence signal occurs when price forms a high above the previous one but the AO high is below the previous one. When price reverses, traders open a sell position with a stop-loss behind the local high.
Calculation
AO computes the difference between the 34-period and 5-period simple moving averages (SMAs), as shown in the following calculation:
AO = SMA (Median Price 5) - SMA (Median Price 34)
Where:
Median Price = (High + Low) / 2


