Introduction to the Trading page
Intro
A chart is a graphical representation of price movement that can be created via the use of various components such as trend lines, candlesticks, bars, Heikin Ashi candles and more.
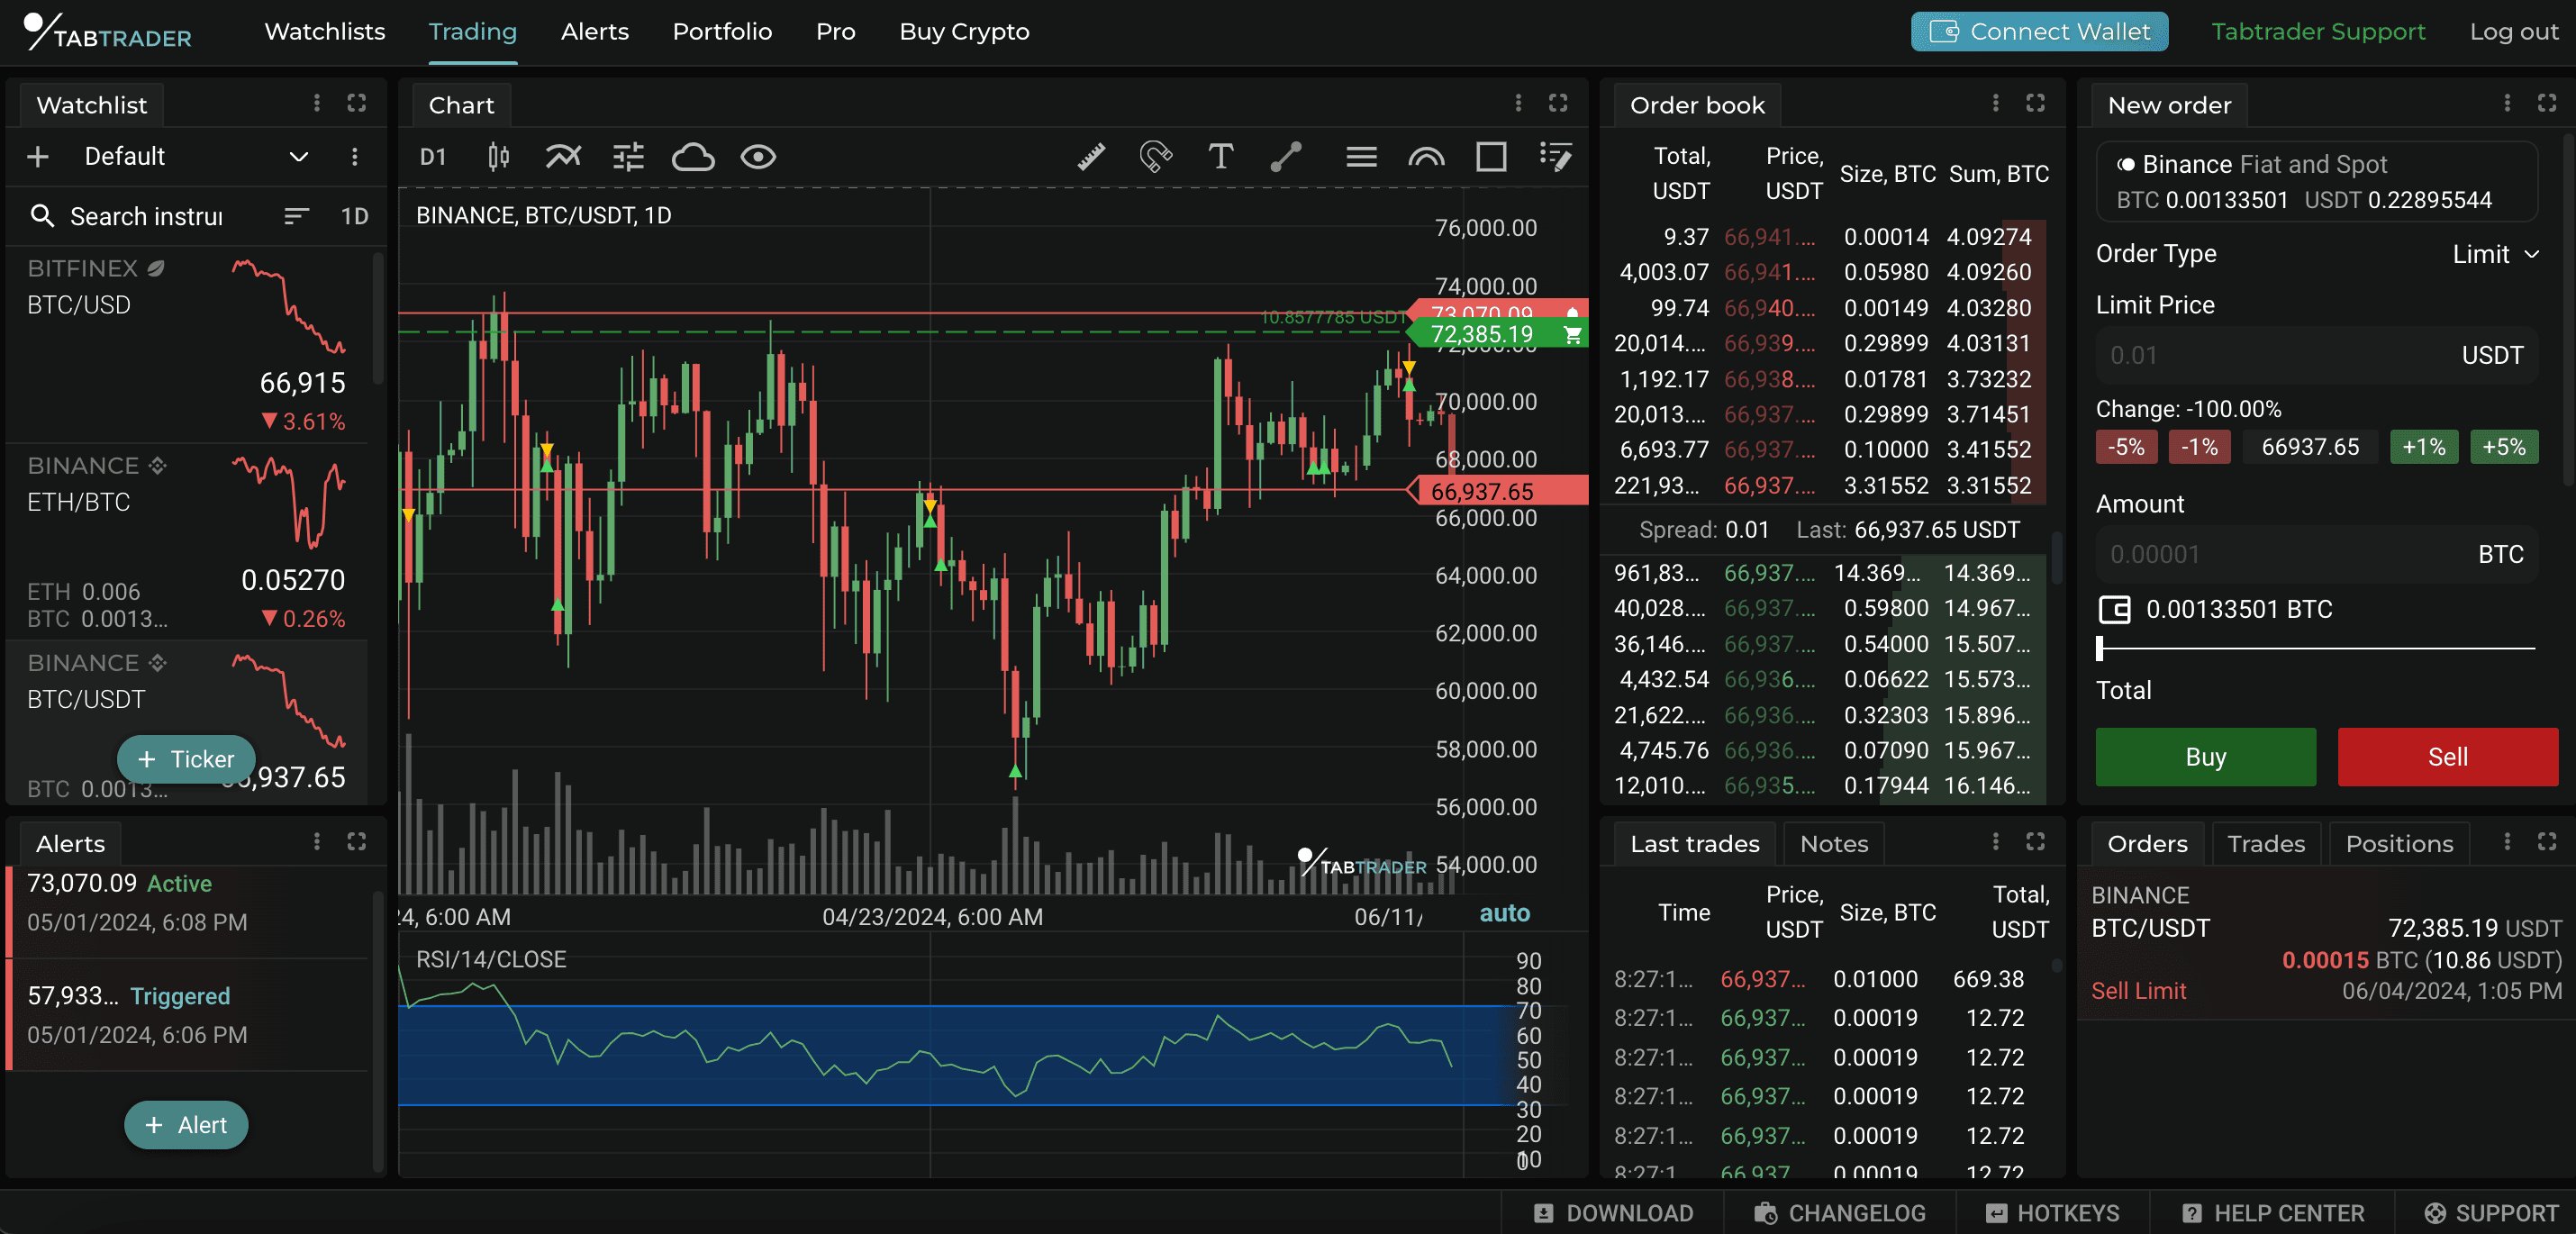
Trading page features all the essential TabTrader tools in one place, allowing you to analyze market data, trade and control your assets, install alert notifications for price changes and navigate to other instruments without leaving the page.
Trading page
In TabTrader Web the Trading page consists of several modules divided into the following categories:
- Market Data: chart, order book and last trades;
- Trading: order form, active orders, trades, positions;
- Alerts: price change notifications;
- Navigation: Watchlists.
More about the modules
Chart
A chart is a graphical representation of the price performance of a trading instrument with powerful built-in technical analysis tools and data to assist your trading. TabTrader provides users with its own bespoke charting.
The Chart module is interactive: you can place alerts, apply shapes, and use the measuring tool. Additionally, you can access the contextual menu by right-clicking on the chart to apply shapes and alerts, select prices for your orders, and utilize layer and visibility options.
Hover your cursor over the chart and use your pointing device to scale in and out (by scrolling the mouse or using a two-finger gesture on the touchpad).
You can use vertical scaling by dragging the price scale up and down. Enable and disable the auto-scaling mode in the lower right corner of the chart.
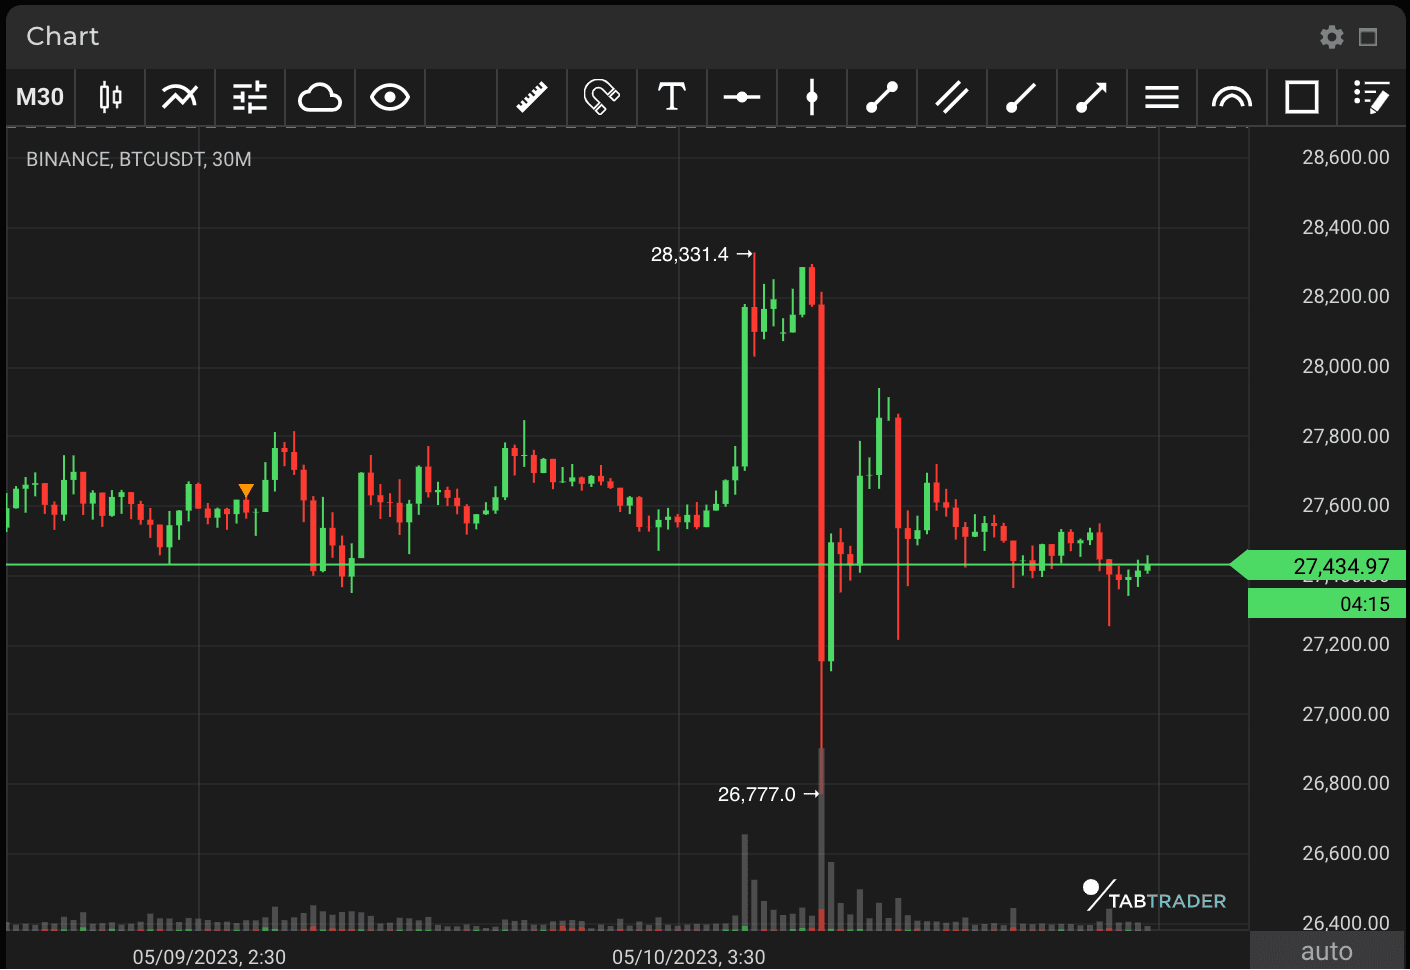
Chart module
The Chart module is equipped with a toolbar right at the top of its screen:
Timeframes — price movement expressed over a certain period of time;
Chart types — representation of price movement in the form of a trendline, bars, standard and Heikin Ashi candles, etc.;
Indicators — pattern-based signals to enhance your technical analysis;
Chart settings – customize the appearance of your chart;
Configurations — make your own preconfigured sets of layers, timeframes and chart types;
Layers visibility — a list of objects to be present or hidden on charts (shapes, alerts, orders, trades, indicators, local min and max prices and countdown timer);
Ruler — a tool to measure time, distance and price on your chart;
Shapes — apply shapes right over the chart to perform your technical analysis.
Watchlist
In the Watchlist module you can manage tickers and switch between your Watchlists.
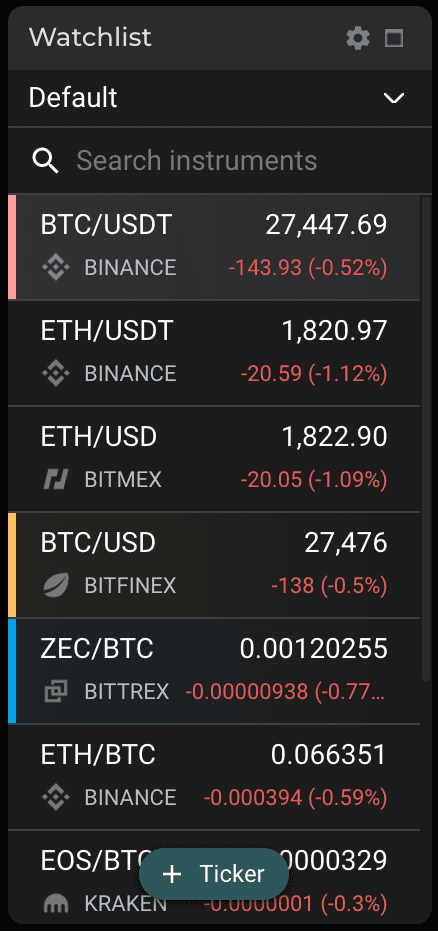
Watchlist module
Alerts
The Alerts module contains the list of alerts associated with the instrument and allows you to perform alerts management.
You can set an alert to notify you when the price of an asset hits a specific threshold.
Alerts can be placed either directly on the chart or by means of the “+ Alert” button.
You can add, edit, enable/ disable and remove alerts.
Use the contextual menu by right-clicking on the module to perform group actions or to edit a specific alert individually.
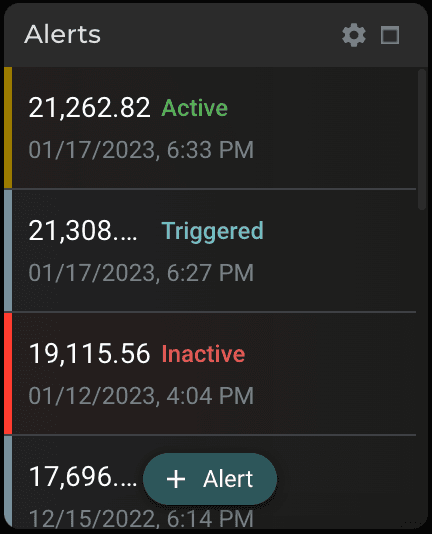
Alerts module
To enable notifications, click “Allow notifications”
Order book
An order book is a real-time updated list of buy and sell orders organized by price level for a selected trading instrument.
Buy orders (colored green) contain buyer information including all bids, the amount buyers wish to purchase.
Sell orders (colored red) behave in the opposite way to bid orders. Your order will be listed on the order book until it is executed.
Scroll up and down to examine the depth of the order book. Click “To center” to return to the spread.
Right click over a price position to place an alert or order.
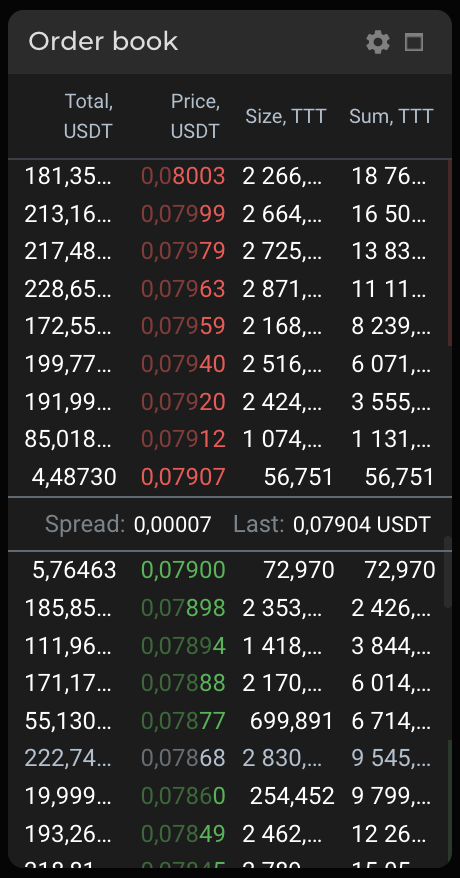
Order book module
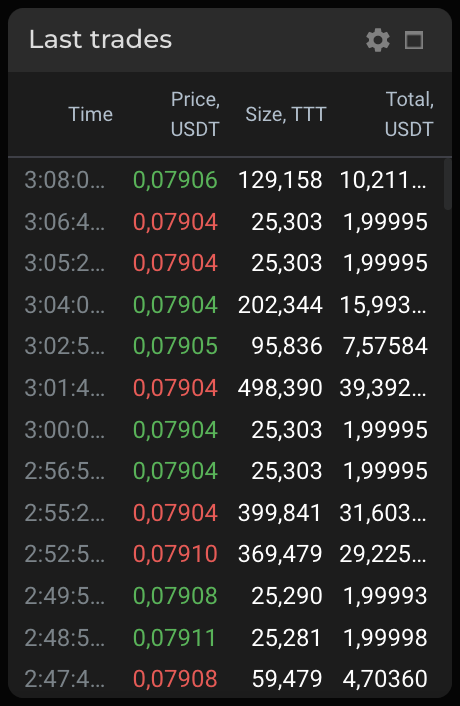
Last trades
The Last trades module shows a constantly updating flow of transactions executed in the specific instrument. In this list you can see the price, trading volume and quote currency size of all recent trades. Scroll up and down to explore up to 100 recent trades.
Last trades module
New order
A module with settings for placing a new order: order type, price, amount and side (buy or sell).
To enable this option, connect your exchange account with API keys.
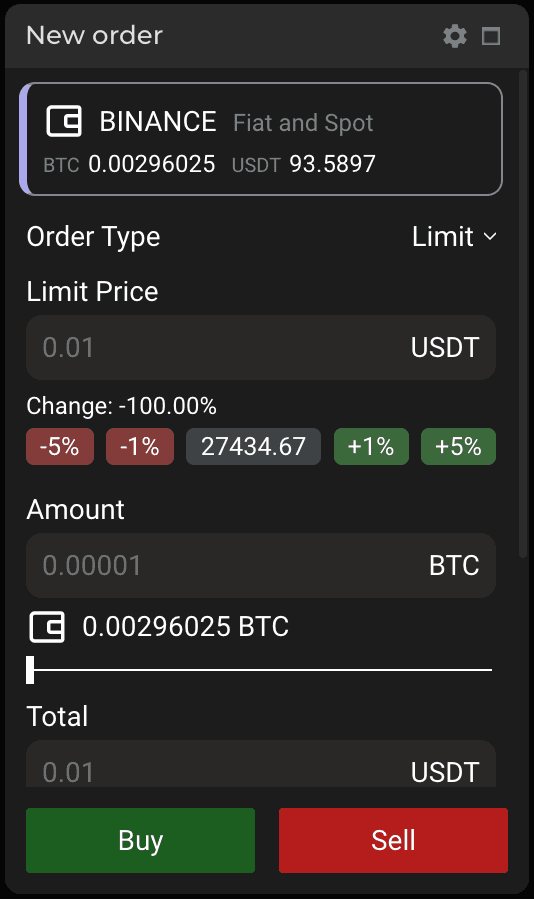
New order form
Orders / Trades / Positions
This module displays the list of your open orders, trades and open positions. Here you can switch between the tabs to check the current status of your positions and your currently open and previously executed orders.
To enable this list, you should connect your exchange account with the API keys.
Layout
The layout of these modules can be customized to your personal preference all over the chart page.
- Click and hold the name of the module, drag the module window and place it into a different location.
- A module window can be resized: Click and hold one of the vertical edges of the window and drag it left/right;
- If the edges of the windows are adjacent, click and hold the contact line and drag it in/out.
Each module can be taken into and out of full-screen mode without any changes in the general layout. The "maximise" button is located in the right upper corner of every module.


