Crypto Chart of the Week: Bitcoin Absorbs War Shock as BTC Tests $74K Resistance

What moved the crypto market this week?
- U.S. and Israeli strikes on Iran pushed Bitcoin down to $63,068 on Saturday. Markets quickly shifted to risk-off, so geopolitics became the main factor for crypto prices early in the week.
- From Wednesday to Thursday, Bitcoin rose from $68,000 to almost $74,000 as short positions closed out. More than $110 million in bearish bets were liquidated.
- Donald Trump’s public support for the Clarity Act raised prediction market odds to about 72% for its passage by 2026, giving the rally a policy boost.
- Spot Bitcoin ETFs had three days of inflows totaling $1.14B, which partly reversed $4B in outflows from the last five weeks. This could mean institutions are stabilizing their positions.
- Bitcoin finished the week up 5.4%, but dropped from $74K to $69K by Friday. The 200-day EMA hasn’t been crossed yet, so the bullish case is still unconfirmed.
Market commentary
The week opened with a shock. As news of US and Israeli strikes on Iran spread over the weekend, Bitcoin briefly fell below $64,000 on Saturday. The initial move was textbook risk-off. By Sunday, the market had already begun to recover.
Monday’s bounce pushed BTC above $69,000, but it fell to the mid-$60s by Wednesday as Asian equities sold off. Thursday’s surge toward $74,000 faded by Friday, leaving it below $71,000. Weekly gains were about 6.8%, but the path was messy.
Why did the bounce happen?
CoinGlass data shows open interest rose 6% on Monday, while price increased 3.8%. This points to a classic short squeeze, not new spot buying. There’s a $218M cluster of leveraged longs between $65,250 and $64,650. If there’s no spot demand, that area could be tested next.
The Bitcoin as a hedge narrative?
A familiar narrative resurfaced this week: Bitcoin as a geopolitical hedge. The data partly supports it, but not completely. On-chain data shows a spike in activity on Iranian exchanges like Nobitex immediately after the strikes, with users moving capital out of local platforms.
While the wider market reduced risk, local users used Bitcoin more for moving capital into self-custody or overseas, rather than as a price hedge, especially during internet slowdowns and sanctions.
Despite its utility for mobility, Bitcoin has failed the "flight-to-safety" price test in 2026. While Gold (XAU) rocketed to record highs above $5,300, securing an 80%+ year-over-year gain, Bitcoin has struggled to decouple from equities. Its 30-day rolling correlation with the Nasdaq has recently surged to 0.75, signaling that institutional desks still treat BTC as "commodified risk" or high-beta tech.
Historically, U.S. military actions coincide with looser monetary policy; the Fed cut rates during the Gulf War and post-9/11. If markets expect a similar response to the prolonged Middle East conflict, Bitcoin could benefit. For now, it’s just a scenario to monitor.
Bitcoin price analysis: BTC/USDT
Bitcoin is pressing against the upper boundary of the descending channel that has capped price since early February. Support continues to cluster around the $68,000 level. Buyers have repeatedly stepped in there, suggesting it has become the near-term floor. The rate of decline is clearly slowing; what’s less clear is whether this week’s move is the beginning of a reversal or a relief bounce inside a continuing downtrend.
Momentum indicators are showing early signs of improvement. The Relative Strength Index has formed positive divergence against price, indicating momentum has been strengthening even as the chart printed lower lows. That pattern often precedes a bounce, although it rarely resolves immediately.
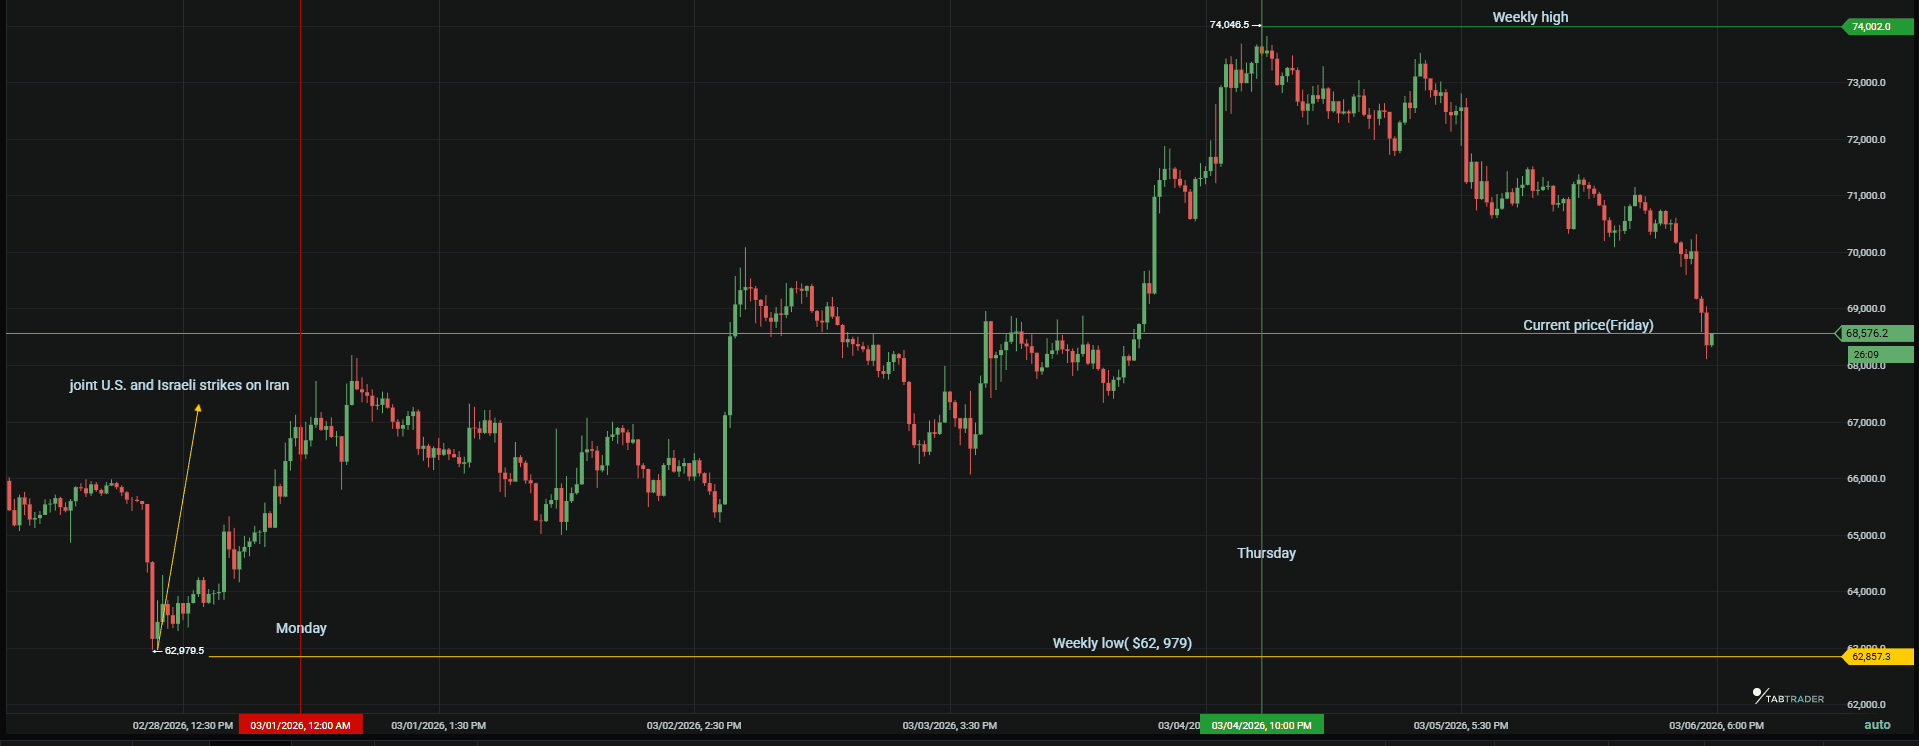
BTC price movements(Monday-Friday)
From a bullish view, the next step is clear: price must reclaim and close above the March 5 high of $74,071 on the daily chart. That level caps the current recovery.
Next, traders watch the 55-day simple moving average near $77,456, then highs around $79,160–$79,370. Above that, the November 2025 low near $80,620 now serves as potential resistance.
By early Friday, Bitcoin had retreated to ~$71,000, down 2.2% from Thursday’s high. Analysts are split: the weekly numbers are still strong (+5.4%), but the move's structure is short-squeeze driven.
Here’s more data to reinforce our technical analysis
- Resistance: Key level is the 200-day EMA near $72,600. This line now acts as the technical ceiling. On March 5, a brief push above $71,000 during a sharp short squeeze liquidated $110 million in bearish positions.
- Support: demand has consistently appeared in the $65,000–$65,800 area. Each dip into that range has been met with fairly decisive buying. The zone lines up with what traders have been calling the Strategy Inc. accumulation area, and it also overlaps with the 0.618 Fibonacci retracement drawn from January’s local bottom.
- RSI Check: the daily Relative Strength Index is sitting near 40. That reading suggests the market has moved out of the deeply oversold territory seen during February’s selloff, but momentum is still fairly muted.
- BTC Dominance: 58.6%. Bitcoin leads; altcoins lag, with SOL notably underperforming.
Ethereum chart of the Week: ETH/USDT
Ethereum has shown slightly stronger recovery momentum than Bitcoin this week recording $169M inflow, the highest since January. Part of that strength comes from renewed attention around the upcoming Prague upgrade, which has cleared several important preparation milestones on mainnet.
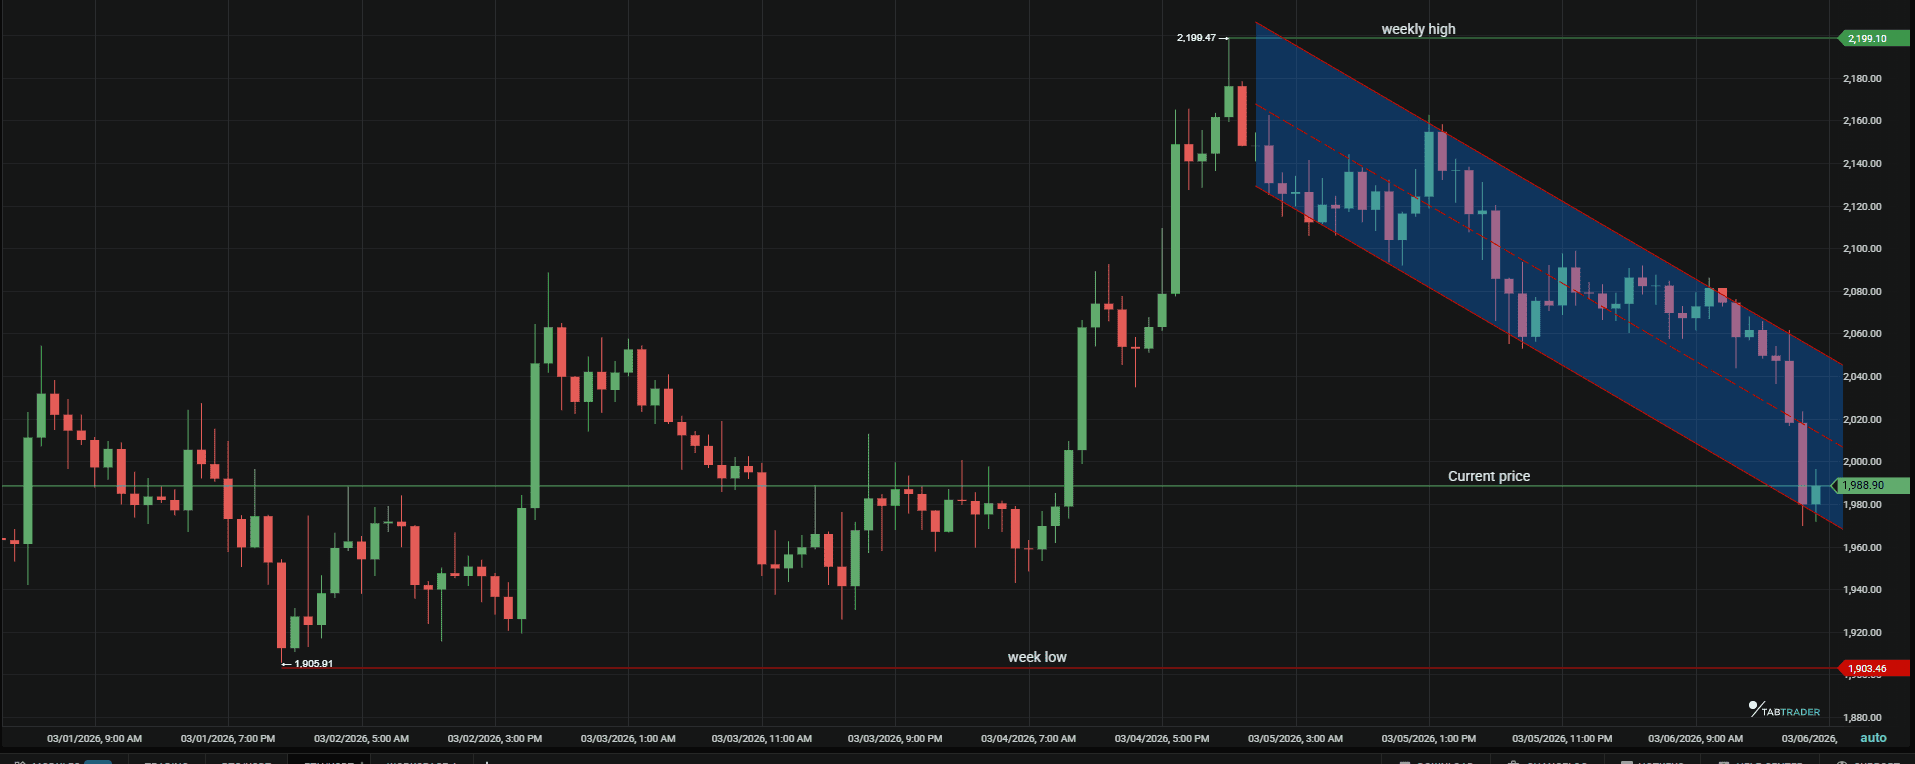
ETH weekly price movements.
Altcoins price movements Snapshot
| ASSET | PRICE (FRI) | WK CHANGE | NOTE |
| ETH | ~$2,080 | ▲ +2.7% | Prague upgrade mainnet milestone cleared mid-week |
| BNB | ~$648 | ▲ +3.1% | Quiet outperformer; steady bid throughout the week |
| SOL | ~$88 | ▲ +2.1% | Worst major performer; war shock lingered in positioning |
| DOGE | ~$0.165 | ▼ −3.7% | Laggard of the week. No catalyst to sustain bounce |
| XRP | ~$1.43 | ±0.2% | Flat; institutional inflows |
*Prices at the time of writing. Get the latest prices from TabTrader charts.
Bottom line
Currently, Bitcoin stands at a decisive crossroads. Continued institutional inflows and a sustained push above $74K could spark a rapid retest of February highs and fuel new momentum. Conversely, if momentum stalls, the significance of the leveraged long cluster near $65K cannot be underestimated, the market’s next chapter will be defined by which side prevails.
Ready to trade the volatility?
Connect to over 20 exchanges from a single dashboard, including Binance and Kraken, now available at 50% off.

Set your alerts on TabTrader Now.
Important Note: TabTrader does not provide investment, tax, or legal advice, and you are solely responsible for determining whether any financial transaction strategy or related transaction is appropriate for you based on your personal investment objectives, economic circumstances, and risk tolerance. Tab Trader may provide information that includes but is not limited to blog posts, articles, podcasts, tutorials, and videos. The information contained therein does not constitute investment advice, financial advice, trading advice, or any other sort of advice, and you should not treat any of the content as such. TabTrader does not recommend that any digital asset should be bought, earned, sold, lent out, or held by you, and will not be held responsible for the decisions you make.