Crypto Market Weekly Outlook: Why is Bitcoin Down and What to Watch (May 25th-29th)

Key takeaways
- Crypto markets turned sharply negative mid-week, wiping nearly $86 billion from the total market cap. Bitcoin tested $74,500 before recovering to the $76,600 range.
- Bitcoin has broken above the upper boundary of its medium- to long-term falling trend channel, a signal that selling pressure may be weakening.
- Reports that the Trump administration may be preparing possible military action against Iran pushed oil prices higher and increased inflation concerns.
Why is Bitcoin down this week?
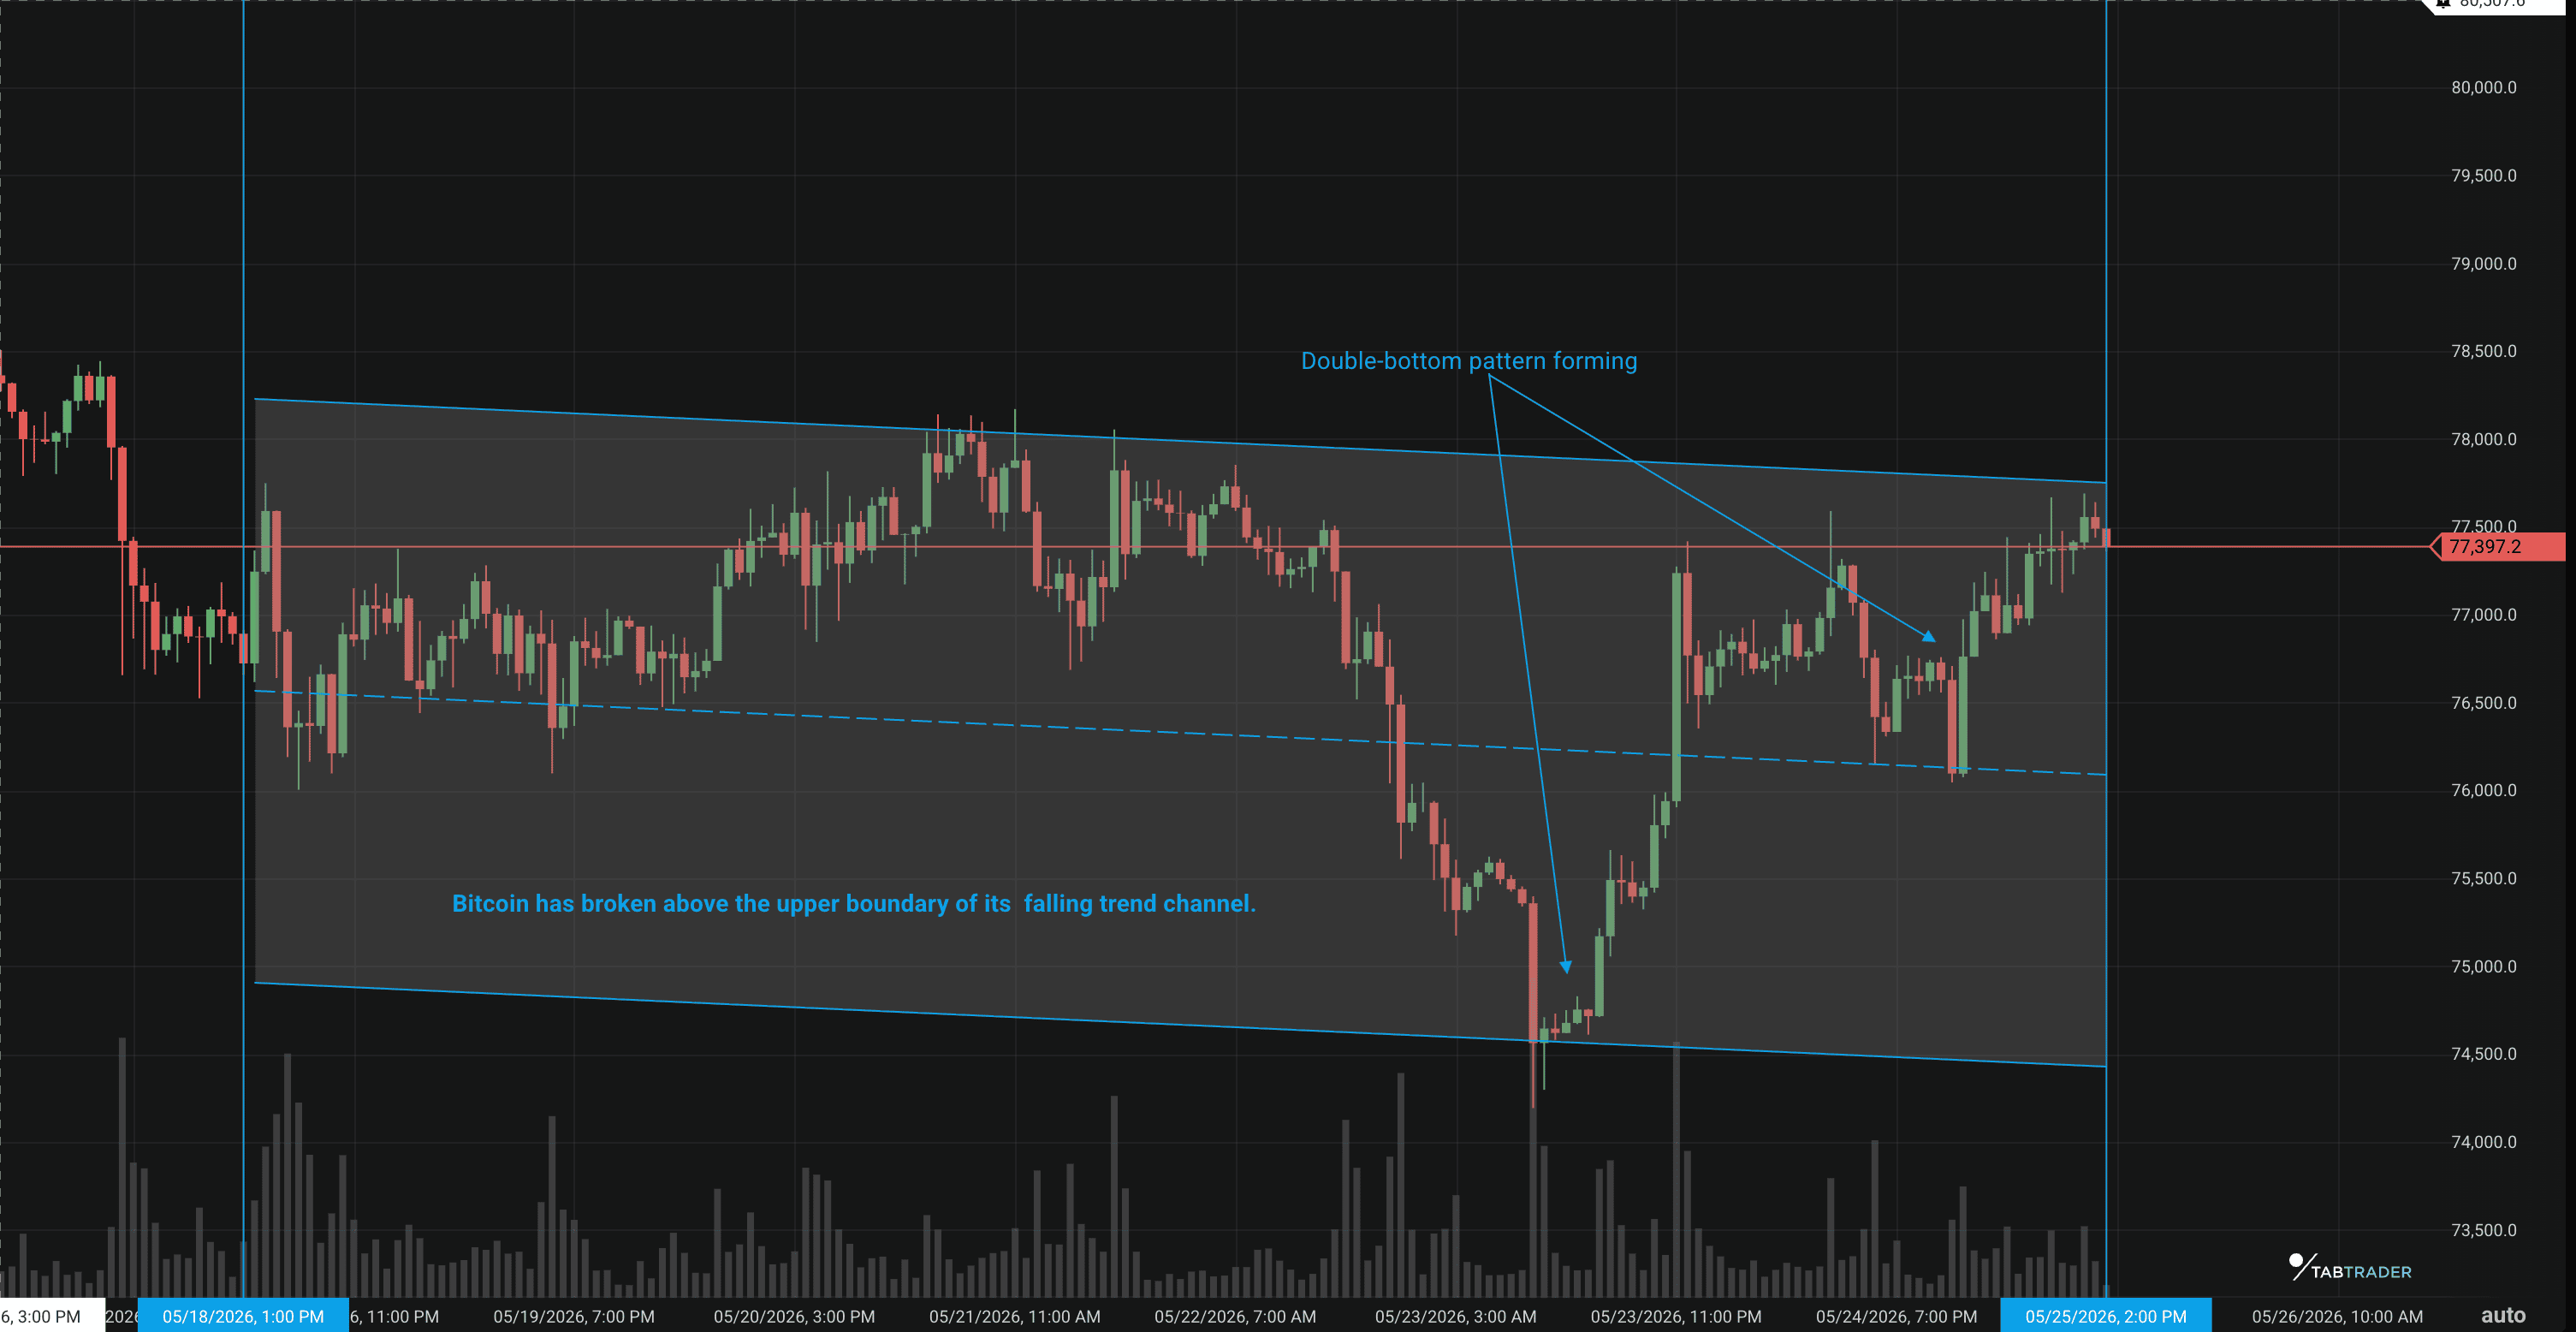
BTC/USDT
All prices are at the time of writing and subject to change.
This week's crypto weekly outlook has been defined by sharp mid-week selling followed by a slow recovery. Markets turned sharply negative on May 22–23, erasing nearly $86 billion from total market cap and driving Bitcoin to $74,50, its lowest level in two months.
At the time of writing, the global crypto market cap stands at $2.57 trillion, having recovered from lows near $2.49 trillion mid-week. Bitcoin is currently trading near $76,874.83, above the 50-day MA at $75,000, having tested a weekly low of $74,500 on May 22–23 before recovering, while altcoins saw even steeper declines.
Here are the four factors driving this week's selloff.
1. SEC delay weighs on market sentiment
One of the biggest triggers came from another regulatory setback tied to tokenized stock trading.
The U.S. The Securities and Exchange Commission reportedly delayed a proposed framework that would have enabled the trading of tokenized U.S. stocks, such as Apple and Tesla.
The proposal aimed to let crypto firms and DeFi platforms offer tokenized shares while still treating them as securities under U.S. law.
The delay hurt sentiment across both crypto and traditional risk markets. At the same time, prediction market odds for the Crypto Market Structure Bill being signed into law dropped from 75% to 70%, adding to the uncertainty.
2. Geopolitical risks add pressure
Markets also reacted to rising geopolitical tensions.Reports that the Trump administration may be preparing possible military action against Iran pushed oil prices higher and increased inflation concerns.
This mirrors the dynamics covered in our April 7–10 geopolitical outlook. Higher energy prices could complicate future Federal Reserve rate cuts, which tend to support risk assets like crypto.
At the same time, rising U.S. Treasury yields and record-high Japanese bond yields are continuing to tighten global financial conditions, a pattern that began accelerating in late February and has weighed on crypto markets ever since.
3. Nearly $1 Billion in liquidations
The selloff triggered another wave of liquidations across leveraged positions.
According to crypto sources, more than 160,000 traders were liquidated over the past 24 hours, with total liquidations reaching about $941 million.
The largest single liquidation reportedly occurred on Bitget and involved a Bitcoin position worth more than $500million, the kind of forced selling that a bearwhale event amplifies into a broader cascade.
4. Institutional flows remain weak.
U.S. spot Bitcoin ETFs have now recorded six consecutive days of outflows totaling nearly $1.44 billion.
On May 22 alone, Bitcoin ETFs saw another $105 million leave the market, with BlackRock accounting for roughly $69 million of the outflows.
Spot Ethereum ETFs have also struggled, posting nearly $500 million in cumulative outflows since May 11. The chart breakdown is covered in our May 15 Chart of the Week.
Bitcoin price analysis (May 25-May 29)
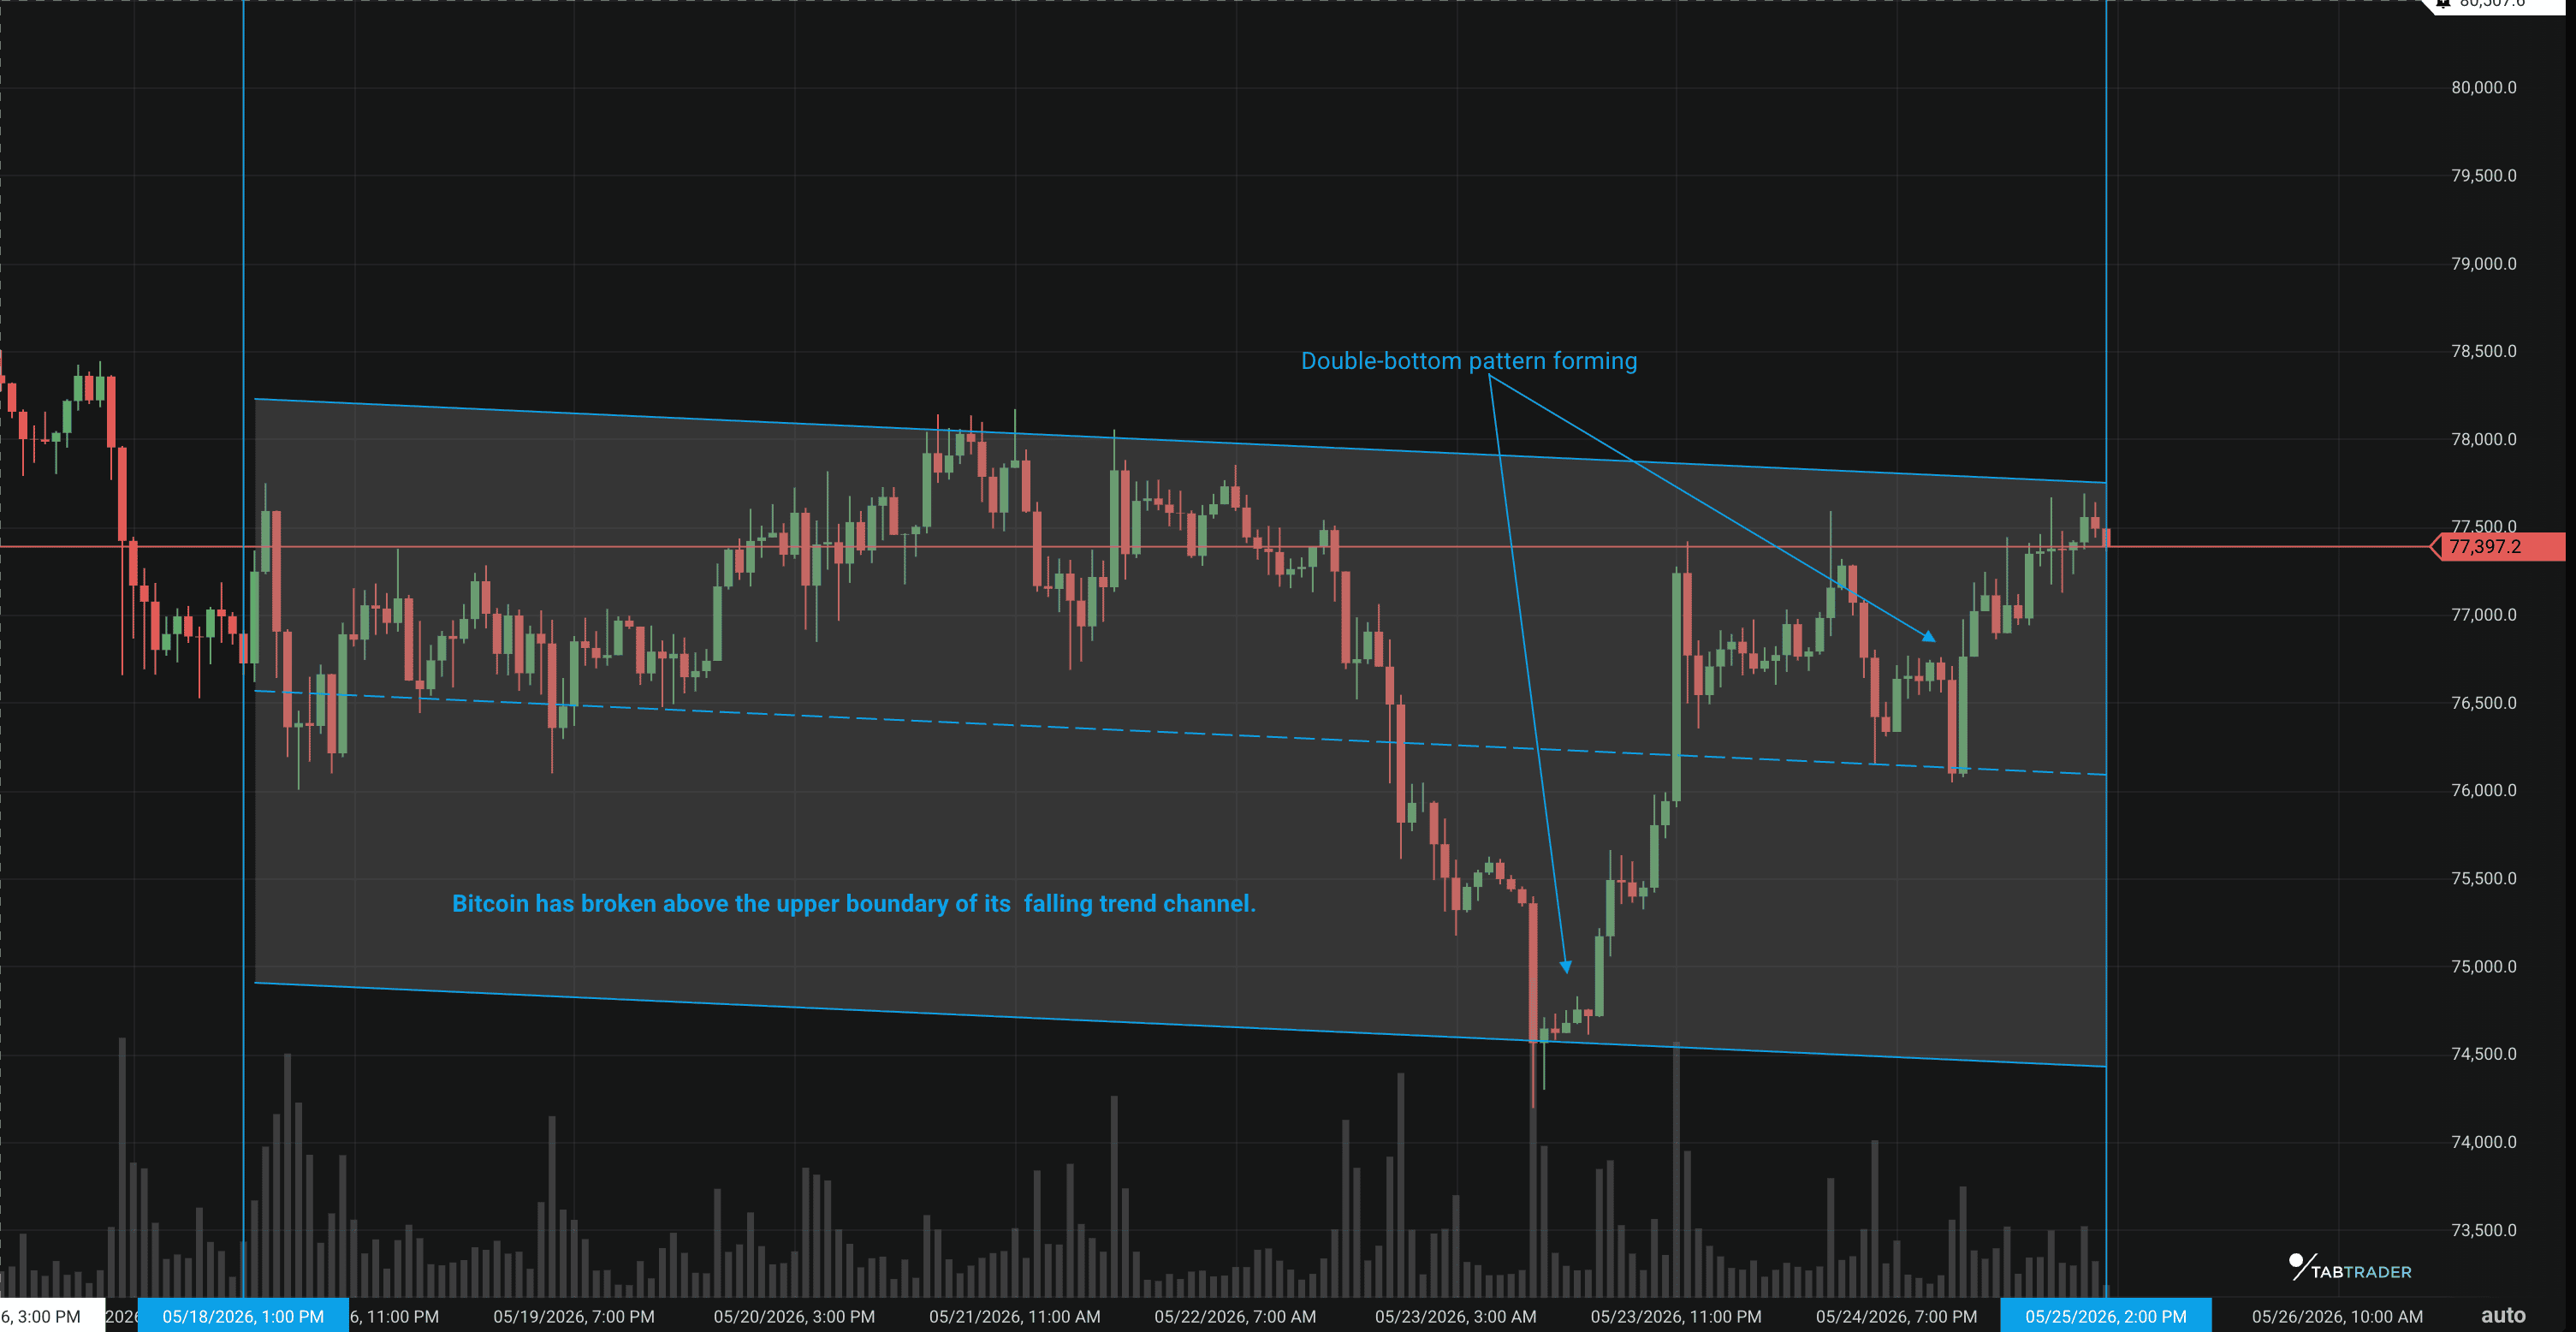
BTC/USDT
BTC/USDT: All prices are at the time of writing and subject to change.
Bitcoin has broken above the upper boundary of its medium- to long-term falling trend channel. This may signal that selling pressure is starting to weaken, with price action shifting into a slower decline or a more sideways trend.
The breakout above $74,885 also confirmed a double-bottom pattern, which is generally viewed as a bullish technical signal. Based on the pattern, the next upside target sits near $84,824.
However, momentum remains fragile. Bitcoin still lacks strong support levels below current prices, leaving room for further volatility if selling returns. On the upside, traders are watching the $82,000 area as the next major resistance zone. Despite the recent breakout, the broader medium- to long-term technical outlook remains weak for now.
Current market levels
- Support: The immediate critical support levels lie at $76,150 and $75,500, with a deeper demand zone building near $74,000.
- Resistance: $82,000, major resistance zone.
Key indicators
- RSI: Bitcoin's 14-day Relative Strength Index (RSI) is currently hovering in the 49 to 52 range across major platforms, indicating a neutral to oversold momentum.Readings in this band are consistent with the morning star reversal conditions traders watch for on the daily chart.
- MACD: Bitcoin’s Moving Average Convergence Divergence (MACD) still points to short-term bearish momentum. The MACD line remains below the signal line across most major tracking platforms, while the histogram stays below zero. Together, these signals suggest sellers are still in control and bullish momentum remains weak.
Ethereum price analysis: (May 25-May 29)
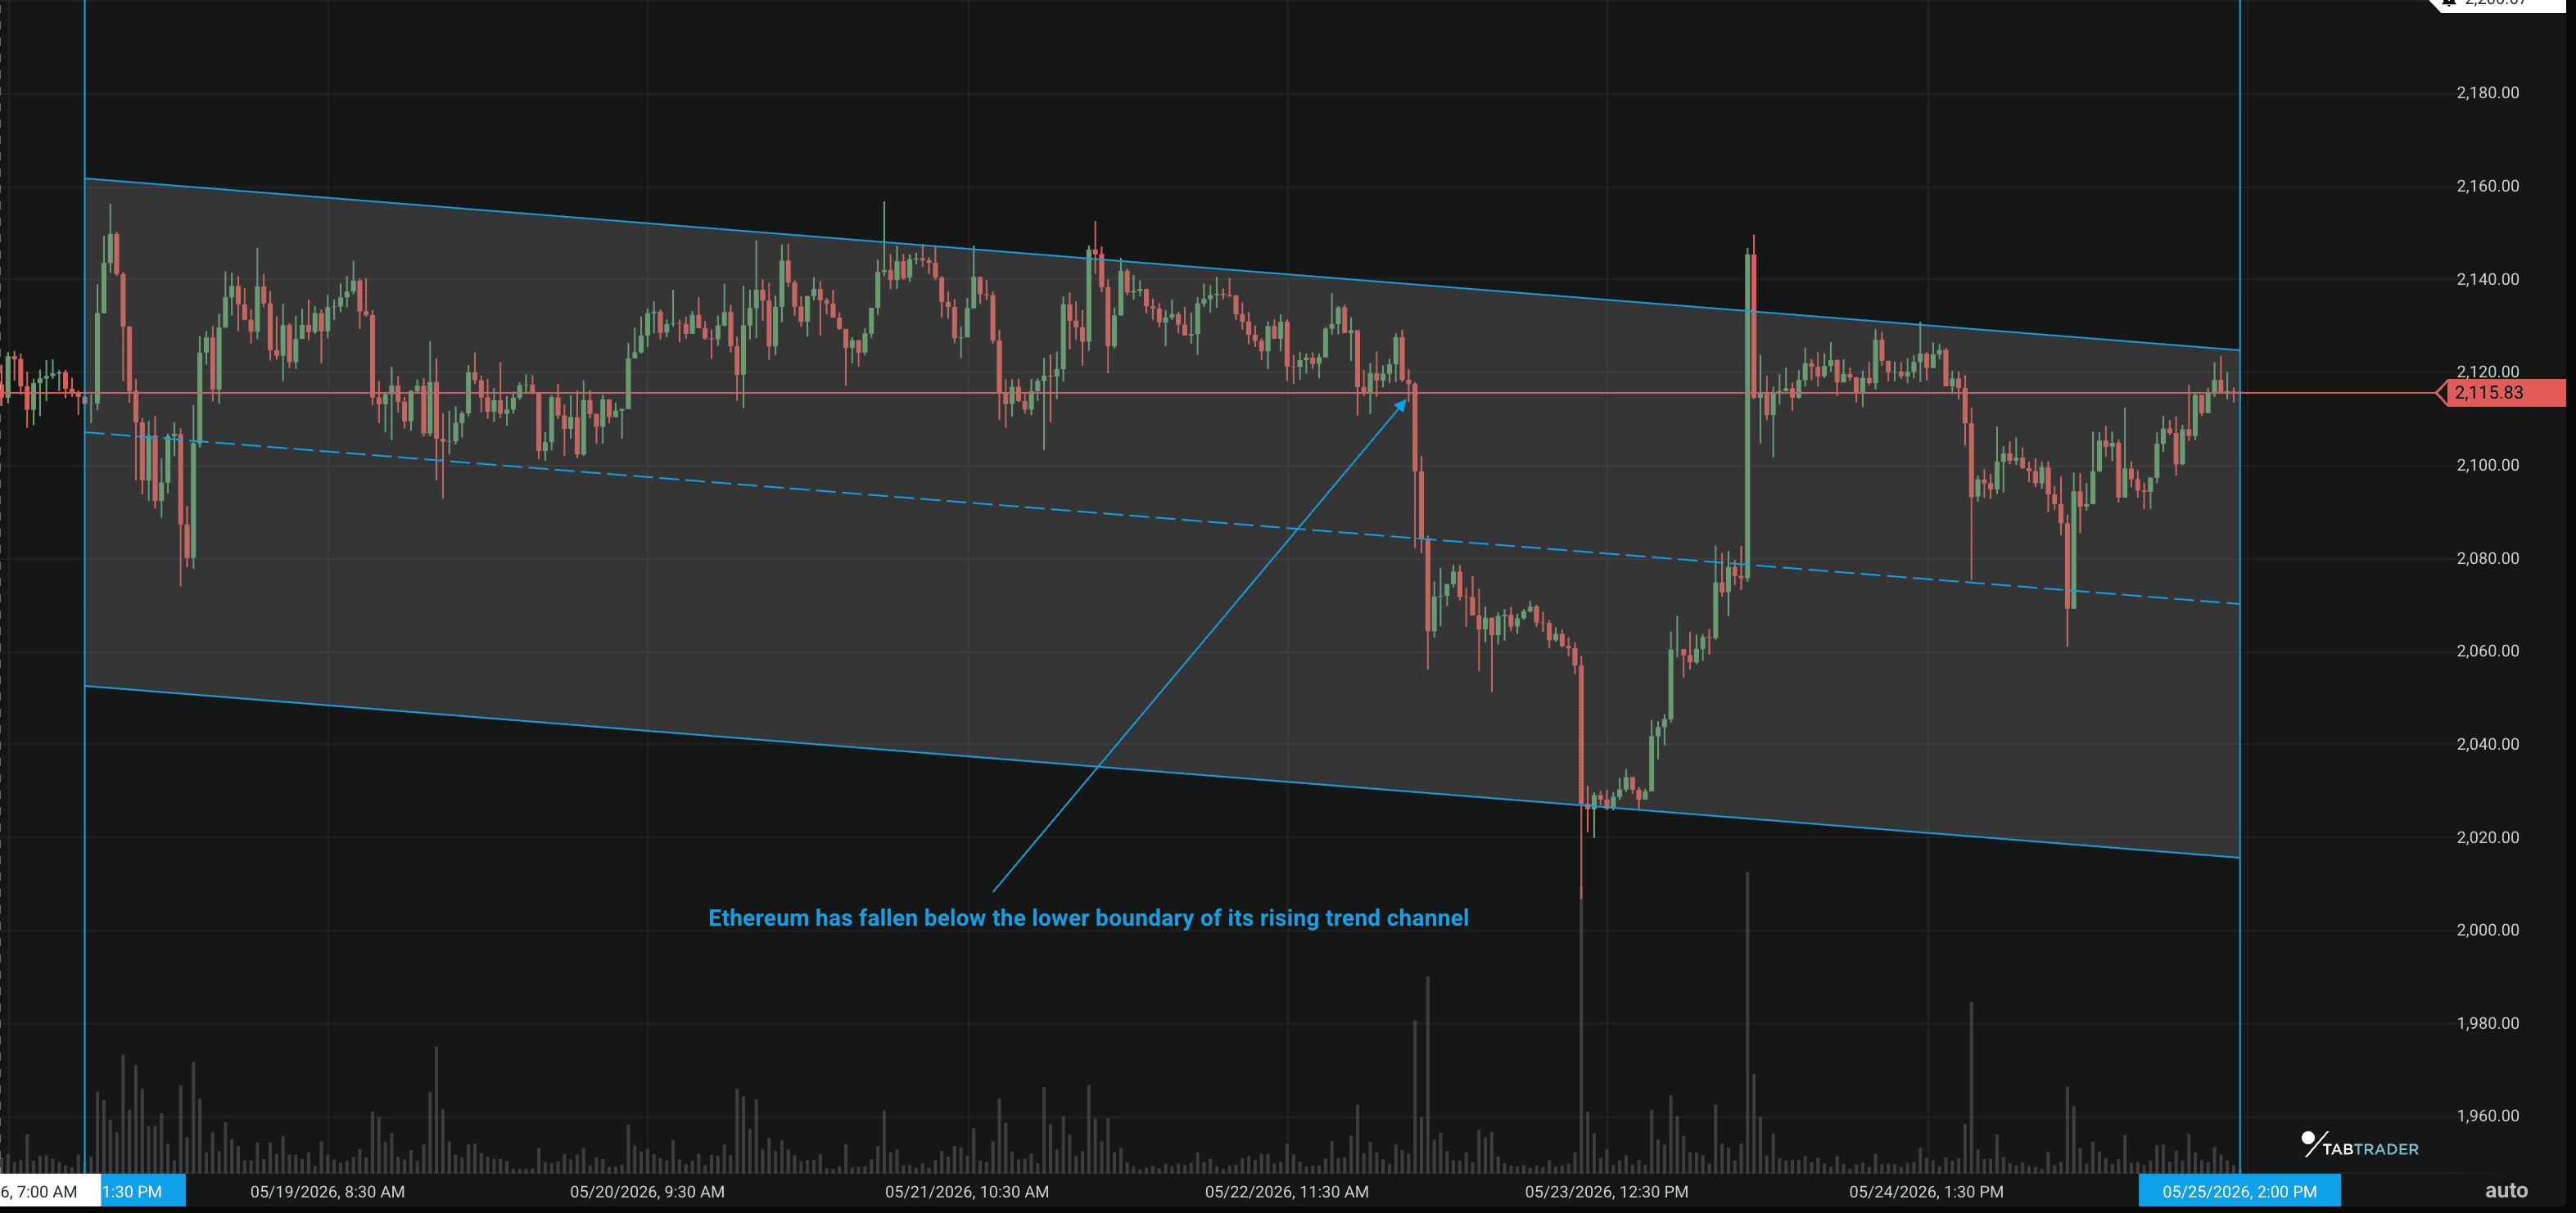
ETH/USDT
Ethereum has fallen below the lower boundary of its medium- to long-term rising trend channel, suggesting bullish momentum is weakening. The breakout may signal a slower pace of gains ahead or a shift into a more sideways trading range.
Key support now sits near $1,830, while major resistance remains around the $2,400 level.
Trading volume has continued to move in line with price swings, with volume peaks and dips matching recent highs and lows. That reduces the strength of the trend-break signal and suggests the market has not fully confirmed a stronger directional move yet.
Key support and resistance zones
- Support: $2,000 – $2,080 (Critical line holding the broader bullish structure together).
- Immediate Resistance: $2,150 - $2,200
Major altcoin sector overview
| Sector | Outlook and Notes |
| Layer 1 | Neutral/Mixed. Layer 1 altcoins are trading mixed this week, with most of the sector moving sideways alongside Bitcoin’s consolidation near the $77,000 range.While overall momentum remains limited, a few networks have posted moderate gains. Some assets, including NEAR Protocol, have also seen short-term increases in trading activity and volatility as traders rotate into selective opportunities. |
| DeFI | Bearish. DeFi total market cap is holding near $61 billion. Legacy DEX tokens continue to trade lower, while decentralized perpetual exchange protocols and Real World Asset (RWA) tokens are attracting stronger interest. |
| Gaming | Bearish. GameFi tokens are moving mostly lower, though on-chain activity and trading volumes remain relatively strong. Tokens tied to active ecosystems are outperforming the broader sector. |
Market metrics and sentiment
- BTC dominance: 60%: Risk keeping traders away from altcoins.
- Fear/Greed index: 41, Neutral. Most traders are adopting a wait-and-see approach this week.
Key events to watch this week
- US Core PCE Price Index ( May 28): As the Fed's preferred inflation metric, a hot print here will systematically compress risk appetite, potentially forcing Bitcoin to test the critical $74,000 – $75,000 structural support zone.
- Nordic Blockchain Conference (Stockholm, May 26–27): This event focuses heavily on enterprise blockchain applications, decentralized system architectures, and compliance alignments within the European MiCA framework.
- Crypto Valley Conference (Switzerland, May 28): A highly technical gathering centering on cutting-edge cryptography research, zero-knowledge scaling solutions, and enterprise-grade asset management infrastructure. Watch for localized volatility or protocol announcements around Swiss-associated ecosystems.
Possible market scenarios for the week
Bearish case
- U.S. Core PCE comes in hotter than expected, reinforcing a hawkish Fed stance and pushing 10-year yields above 4.7%.
- Geopolitical tensions escalate; oil prices rise above $100/barrel, adding to stagflation fears.
- Capital continues to exit spot crypto ETFs; leveraged longs face further liquidations.
Neutral case
- GDP and PCE prints land near expectations, keeping Fed policy unchanged.
- Geopolitical negotiations remain unresolved but stable; oil prices stay near $95/barrel
- Trading activity stays muted, with capital rotating within crypto rather than returning broadly. Decentralized AI and Hyperliquid attract selective attention.
Bullish case
- The U.S. and Iran reach an agreement to reopen the Strait of Hormuz; oil supply fears ease.
- Core PCE comes in below forecasts; U.S. yields drop toward 4.4% and the Fed outlook softens.
- Risk appetite returns, the dollar weakens, and institutional ETF flows reverse from outflows to inflows. Bitcoin and altcoins recover broadly.
Bottom line
The two headline risk events for this week's crypto market outlook are Thursday's U.S. Q1 GDP revision and Friday's Core PCE inflation print. Together, they are the primary volatility drivers for the market.
Bond markets are already positioned for a 'higher for longer' rate environment with the 10-year yield near 4.6%, so a hotter inflation print is partially priced in. The bigger surprise risk is a downside miss, a softer Core PCE could trigger a rapid repricing in rate expectations and push Bitcoin back above $80,000.
FAQs
1. Why is Bitcoin falling while the stock market feels relatively stable?
It comes down to a major structural shift in US monetary policy and institutional fund flows. With newly appointed Fed Chair Kevin Warsh taking a hawkish stance to fight stagflation, markets are now pricing in interest rate hikes rather than cuts, pushing the 10-year Treasury yield past 4.6%.
2. How is the geopolitical conflict over the Strait of Hormuz directly impacting Bitcoin's price?
The three-month conflict in the Middle East has turned energy prices into a primary inflation input. Bitcoin will continue to experience volatile, news-driven "chops" within its current channel. Learning how to trade long-wick candles, the signature pattern of news-driven volatility spikes, can help traders navigate these conditions without getting shaken out.
3. What is the most important technical level traders should watch this week?
The absolute critical level to watch is the $74,000 to $75,000 structural support zone. This represents the lower boundary of Bitcoin’s multi-month ascending trend channel. Set a live price alert on TabTrader to be notified the moment either level is tested.
Spot key levels in real time, then trade smarter live on TabTrader.
Important Note: TabTrader does not provide investment, tax, or legal advice, and you are solely responsible for determining whether any financial transaction strategy or related transaction is appropriate for you based on your personal investment objectives, economic circumstances, and risk tolerance. Tab Trader may provide information that includes but is not limited to blog posts, articles, podcasts, tutorials, and videos. The information contained therein does not constitute investment advice, financial advice, trading advice, or any other sort of advice, and you should not treat any of the content as such. TabTrader does not recommend that any digital asset should be bought, earned, sold, lent out, or held by you, and will not be held responsible for the decisions you make.