Crypto Chart of the Week: Bitcoin Presses Toward $80K As Strategy Overtakes BlackRock Bitcoin Holdings
Key takeaway:
- Bitcoin printed its highest level since late January at $79,388 before pulling back. That rejection, not the rally, is the most important signal of the week.
- Bitcoin couldn’t break above $80,000, even after eight straight days of ETF inflows. Now, either a new catalyst will push it higher, or momentum will start to slow. Institutional demand, macro policy, and global events all play a role in what happens next.
- Track Bitcoin and other markets live on TabTrader. Sign up today to analyze charts in real time.
What happened this week in Crypto?
Over five sessions, the market followed a clear arc: Bitcoin rallied into a major resistance zone on strong institutional demand, reached $79,388, and then pulled back as geopolitical uncertainty returned.
Bitcoin’s rise from $73,854 on Monday to $79,388 on Wednesday was fueled by three main factors. The drop that followed was caused by just one.
The three forces driving the rally
- ETF demand: Spot Bitcoin ETFs saw eight days in a row of net inflows, including about $223 million on April 23. This is the longest streak since February and shows steady institutional buying, not just short-term trading.
- Strategy's $2.54 billion purchase: On April 20, Strategy bought 34,164 BTC at an average price of $74,395 each, bringing its total to 815,061 BTC. This move put Strategy ahead of BlackRock’s IBIT for the first time in the ETF era and boosted market confidence.
- Ceasefire extension: The US and Iran extended their ceasefire on Wednesday morning, which gave risk assets a quick boost. Bitcoin jumped from $76,341 to $79,388 that day. Oil prices dropped, and stocks reached new highs.
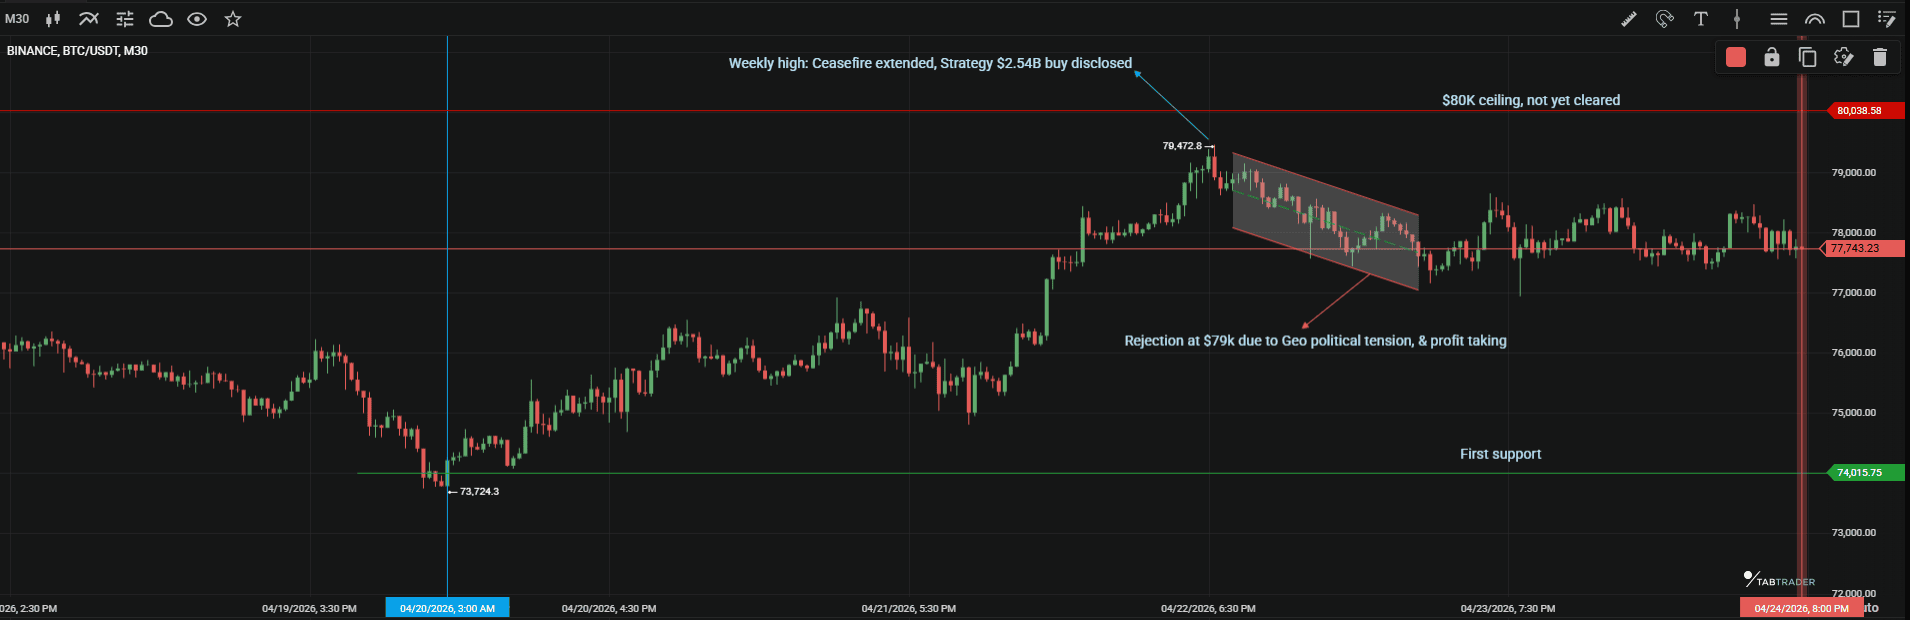
BTC/USDT: The rally hit strong resistance, raising questions about what happens next.
BTC/USDT
Refresh the chart of TabTrader to get the live BTC/USDT prices.
What this weekly chart shows: Bitcoin cleared the $76,400–$77,000 zone that had been capping price since February, pushed toward $80,000 on the back of a genuine macro catalyst and the single largest corporate Bitcoin purchase on record, and then stalled.
The rejection at $79,472 is not necessarily the end of the move, but it is the market's clearest signal that $80,000 is not a gift. It needs to be earned with either a geopolitical resolution or a shift in the underlying derivatives positioning.
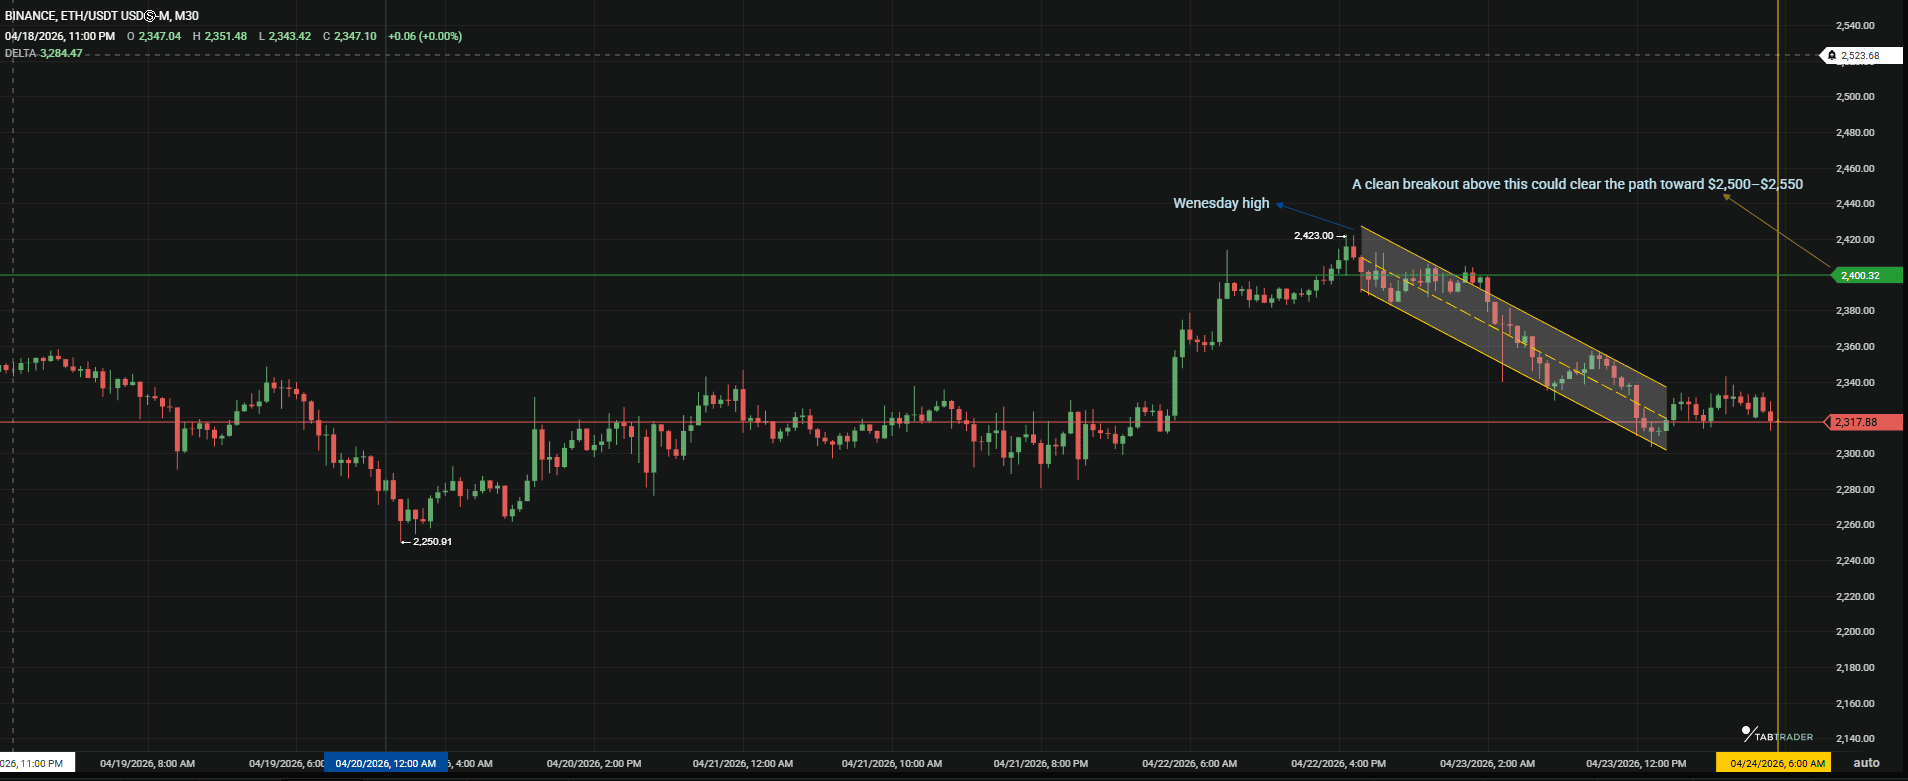
ETH/USDT daily: stabilizing, not leading
BTC/USDT
Refresh the chart on TabTrader for live ETH/USDT price.
What this chart shows: ETH is doing the right things technically, holding support, reclaiming $2,400, printing a higher-timeframe momentum signal.
ETH’s price is rising mainly because Bitcoin is up; it’s following Bitcoin’s lead rather than moving on its own demand. Keep an eye on the ETH/BTC ratio: if it stays above 0.035 on the weekly chart, that shows ETH is gaining strength compared to BTC. If it stays below 0.031, ETH is still behind and lacks its own momentum.
What to watch next week
Next week, pay attention to Fed policy and Middle East developments as primary market movers.
On the Fed side, the goal isn’t to track every detail. You should know when information hits and how markets tend to react.
- FOMC meetings: There are eight scheduled meetings a year, and they’re the main decision points for rates and policy. Markets usually slow down ahead of them, then move quickly once the outcome is clear.
- Policy announcements: The statement drops on the second day at 2 p.m. ET. That’s the first reaction window, when you should expect volatility.
- Minutes: Released a few weeks later. Less immediate impact, but useful for understanding how aligned (or divided) policymakers are.
- Speeches and press conferences: Jerome Powell and other Fed members often move markets with tone alone. The wording matters, and small shifts between hawkish and dovish can reset expectations pretty quickly.
On the geopolitical side, speed matters more than depth. Markets react to headlines first and details later.
- Real-time news: Reuters and Bloomberg are usually the fastest for confirmed updates. This includes strikes, ceasefire developments, and anything involving the Strait of Hormuz.
- Policy-focused reporting: Axios tends to surface U.S. intelligence angles and behind-the-scenes developments.
- Social feeds: Verified analysts and defense reporters on X often flag developments before they hit mainstream outlets. Useful, but requires filtering.
That’s the landscape. If Fed expectations stay stable and geopolitical risk doesn’t escalate, markets can keep leaning risk-on.
FAQs
1. Why did Bitcoin fail to break $80,000 this week?
Bitcoin touched $79,388 on Wednesday but found consistent sellers just below $80,000. Two factors explain the ceiling. First, $80K is a major psychological level with significant limit-sell orders sitting above it. Second, funding rates in Bitcoin perpetuals have been negative for 47 consecutive days, meaning the rally is being carried by spot buyers, not leveraged longs.
2. What does Strategy topping BlackRock mean for Bitcoin?
Strategy's purchase of 34,164 BTC pushed its total holdings to 815,061 BTC, more than BlackRock's IBIT (802,824 BTC) for the first time in the ETF era. The significance is structural: it confirms that corporate treasury buyers are now large enough to compete with the world's largest asset manager as a source of Bitcoin demand.
3. Is the crypto winter really over, as Saylor claims?
There are two dominant interpretations:
Saylor's view is that the Bitcoin bottom near $60,000 in February marked the end of the bear phase. Analyst Mati Greenspan argues that there was no true winter, only a bull-market correction, which implies a faster recovery than Saylor's seasonal metaphor suggests. Both agree on direction: the bottom is likely in.
Track Bitcoin and other markets live on TabTrader. Sign up today to analyze charts in real time.
Important Note: TabTrader does not provide investment, tax, or legal advice, and you are solely responsible for determining whether any financial transaction strategy or related transaction is appropriate for you based on your personal investment objectives, economic circumstances, and risk tolerance. Tab Trader may provide information that includes but is not limited to blog posts, articles, podcasts, tutorials, and videos. The information contained therein does not constitute investment advice, financial advice, trading advice, or any other sort of advice, and you should not treat any of the content as such. TabTrader does not recommend that any digital asset should be bought, earned, sold, lent out, or held by you, and will not be held responsible for the decisions you make.