Crypto Market Weekly Outlook: Breakout or Rejection at $70,000?
Key takeaways
- BTC recovered from a weekend low of $63,000 to around $68,600 today, driven by sustained institutional ETF inflows and continued corporate accumulation. This recovery differs from prior short-squeeze rallies. The move appears gradual and allocation-driven rather than speculative, suggesting that the market is pricing in the ongoing conflict but remains resilient.
What's the Crypto Outlook this week?
Crypto enters March with a decisive shift in momentum. Bitcoin (BTC) flash-crashed to $62,920 following U.S. military strikes on Iran over the weekend, then staged a sustained recovery to $69,471, driven primarily by renewed institutional buying through spot ETFs. Ethereum has pushed through $2,063 and Solana is up 7.7% to $89.29.
The short-term outlook has shifted to resilient but range-bound amid day three of escalating geopolitics. BTC has cleared the $68,662 and the next major test is $70,000. A confirmed daily close above that level of volume would materially upgrade the structure.
If BTC fails to hold $68,662 on any pullback, the move risks becoming a wick into resistance rather than a structural breakout.
Bitcoin technical analysis
As of writing, Bitcoin is holding up trading above $68,600. The weekend escalation between the U.S. and Iran triggered immediate volatility across crypto. Iran responded with strikes targeting locations in Israel, Qatar, the UAE, Bahrain, and U.S.-linked bases in Iraq. As expected, 24/7 markets absorbed the shock first.
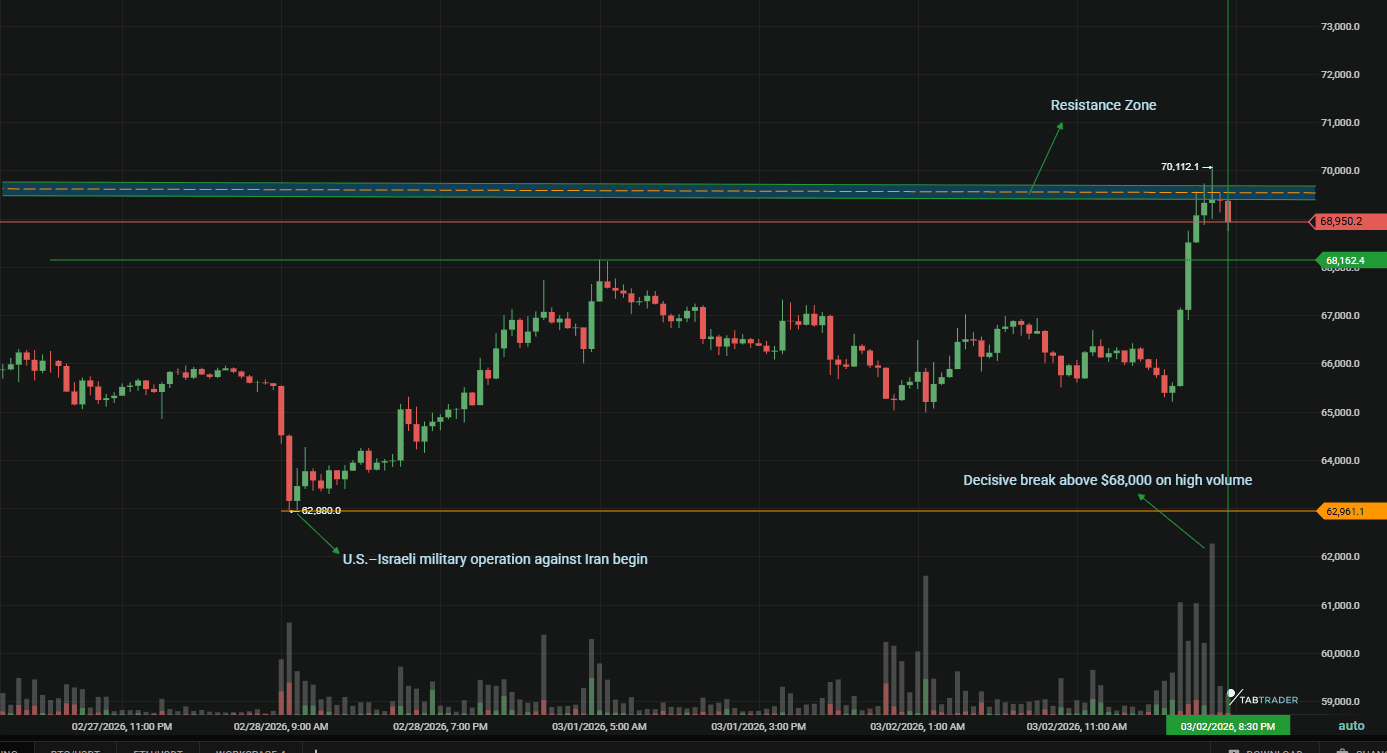
BTC/USDT
As shown on the chart, BTC sold off hard but rebounded after reports of Ayatollah Ali Khamenei's death without major violence. BTC has cleared the $68,662 Fibonacci extension and is testing $69,508; $70,000 is the next critical test.
Key levels
- Immediate Support: $64,000
- Psychological Support: $60,000
- Prior resistance, now support: $68,000
- Critical psychological and technical resistance: $70,000 (Based on the50-day moving average)
The $68,000 area matters. It was prior support before the breakdown. Until price decisively reclaims it, rallies are suspect.
Technical indicators
- RSI: Rebounded to ~60–65, reflecting the sustained recovery to $69,471.
- MACD: Rising and momentum is improving, but bulls need a bullish cross to shift the tone.
- Trend structure: Recovering but still within a broader consolidation range.
Key signal to watch
A daily close above $70,000 confirms the breakout and opens the path to $71,000 (50-day MA). Failure at $70,000, with a pullback below $68,662, suggests the presence of resistance. Below $65,923, the bullish case weakens materially.
Ethereum technical analysis
ETH has broken above the $2,050 resistance level flagged in prior analysis. This is a meaningful development. If $2,050 holds as support on a retest, the structure shifts from hesitant to constructive.
On-chain fundamentals remain strong:
- Layer 2 networks continue processing over 4M daily transactions.
- ETH staking remains elevated (over 37M ETH staked).
- Exchange balances continue trending lower.
Below $2,000, ETH’s chart stays technically soft. Despite growing activity, upside has not been sustained, and the disconnect persists.
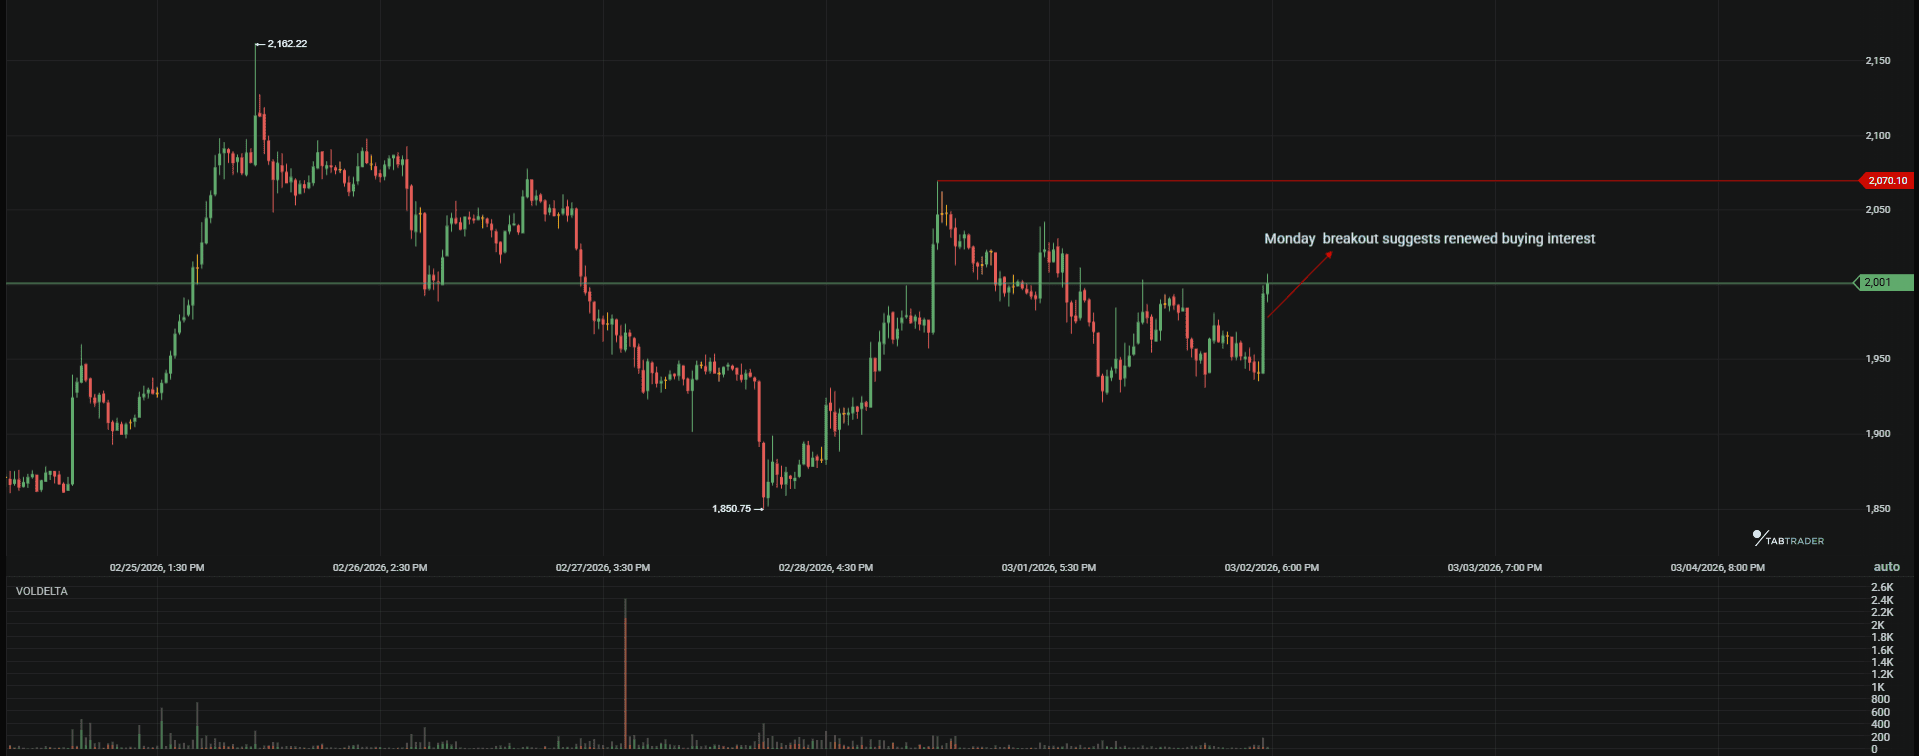
ETH/USDT
Key zones
- Support: $2,000
- Resistance: $2,200
A clean move above $2,050 would stabilize the short-term structure. Until then, ETH remains reactive and relatively weaker on a cross-asset basis.
Ethereum’s network remains active, but price action is hesitant. In this environment, flows outweigh fundamentals.
Key signal to watch
A daily close above $70,000 confirms the breakout and opens the path toward $71,000 (50-day MA). Failure at $70,000, with a pullback below $68,662, would suggest this is a wick into resistance. Below $65,923, the bullish case weakens materially.
Major altcoin sector overview
Altcoins are participating for the first time in weeks buoyed by increased market activity led by SOL in volume and momentum. Here’s how the altcoin sector played out these past seven days.
Layer 1 tokens
Solana is trading around $87, and is leading in volume across majors outside BTC and ETH. Liquidity is concentrated there, which helps it absorb macro shocks better than smaller caps. SUI, near $1.81, has shown relative firmness compared to much of the mid-cap field. AVAX remains range-bound.
Traders are sticking with networks that have active ecosystems and deep order books.
DeFi
Total value locked hasn’t collapsed, but token prices are drifting lower. There’s no clear catalyst and no visible influx of new capital. In this environment, stable TVL isn’t enough to drive price appreciation.
DeFi tokens need either momentum or new narratives, neither of which is present at the moment.
Gaming / AI tokens
This segment remains the most sensitive to risk sentiment. When macro stress rises, speculative themes are usually the first to get cut. That’s happening again.
Price structures here are weaker than in Layer 1 majors, and liquidity thins out quickly during sell-offs.
Sector summary
Infrastructure-focused Layer 1s are holding up better than narrative-driven sectors like gaming and AI. Traders appear to be prioritizing liquidity and network activity over long-duration speculation.
If conditions calm, that rotation could reverse. For now, capital is staying closer to the core.
Market metrics and sentiment
- Fear & Greed Index: 15 (Extreme Fear). Historically, readings this low have coincided with local bottoms, but it requires a catalyst to flip.
- BTC Dominance: 56.1%. This is because capital is rotating back into Bitcoin as traders exit riskier altcoin positions.
Key events to watch this week
- All week: Geopolitical updates (mostly Middle East headlines).
- March 3: Eurozone CPI Inflation Data: Flash data impacting European Central Bank (ECB) policy expectations.
- March 6: U.S. employment report
Possible scenarios for the coming week
Bullish case
BTC closes above $70,000 on strong volume. ETF inflows continue at pace. ETH holds $2,050 as support and altcoins broaden the recovery. Catalyst: U.S. equities stabilize on open, confirming the geopolitical shock is largely priced in.
A rally above $69,000 could push momentum toward $74,000 if supported by rising trade volume and improved sentiment.
Neutral case
The neutral case is that BTC consolidates between $65,923 and $68,662 with no expansion in volume. That keeps the price trapped inside the post-selloff range.
In this scenario, attention drifts toward next week’s CPI print. Volatility compresses, funding normalizes, and traders reduce position size. These stretches feel slow, but they often precede larger moves.
Bearish case
We might fall into a bear market if there's a clean break below $63,000 invalidates the current range.
If that level fails, liquidity is likely to thin quickly, opening the door to a quick move toward $60,000. A sharp wick below that level is possible if it stops clustering tightly. Whether it holds would depend on how equities respond when U.S. markets are fully open.
At this stage, $63,000 is the macro floor. Range survives above; below, downside accelerates.
Bottom line
The story has changed materially since the weekend. BTC's recovery from $62,920 to $69,471 , driven by sustained institutional ETF inflows rather than a short-term mechanical event , has shifted the near-term structure from bearish to cautiously bullish. The Fibonacci extension at $68,662 has been cleared. The $69,508 target is being tested. $70,000 is next.
If you’re trading actively, watch relative performance. Geopolitics remains the wildcard. How U.S. equities open today is the single most important near-term signal. Until that picture clears, size positions accordingly.
Don’t try to predict the market. React to what actually happens. Set up your alerts on TabTrader and let the price come to you.

Set your alerts.
Important Note: TabTrader does not provide investment, tax, or legal advice, and you are solely responsible for determining whether any financial transaction strategy or related transaction is appropriate for you based on your personal investment objectives, economic circumstances, and risk tolerance. Tab Trader may provide information that includes but is not limited to blog posts, articles, podcasts, tutorials, and videos. The information contained therein does not constitute investment advice, financial advice, trading advice, or any other sort of advice, and you should not treat any of the content as such. TabTrader does not recommend that any digital asset should be bought, earned, sold, lent out, or held by you, and will not be held responsible for the decisions you make.