Crypto Market Weekly Outlook: Why Is Bitcoin Up and What to Watch (April 20th-24th, 2026)
*Updated 2026-04-21
Key takeaways
- Bitcoin has rallied due to three drivers aligning at once: a temporary easing of geopolitical risk, a sharp pickup in ETF inflows, and renewed attention to U.S. crypto legislation.
- This week's central event is the April 22 US–Iran ceasefire deadline. The range of outcomes is wide; market reaction will hinge on how definitive the headlines are.
- Key BTC levels: $74K support, $84K overhead resistance (aligns with the 200-period MA). Key ETH level: $2,500 barrier before any move toward $3,000.
Why is Bitcoin up this week?
Over the past week, Bitcoin has had a refreshing rally, and it comes down to three drivers lining up: a temporary easing of geopolitical risk, a sharp pickup in ETF inflows, and renewed attention on U.S. crypto legislation.
1. Institutional ETF flows are doing the heavy lifting
Start with flows. Spot Bitcoin ETFs pulled in roughly $996 million over the week. That kind of demand tends to anchor price action. That amount of inflows is slower, less reactive capital than what you see on derivatives exchanges. When that bid shows up, dips get bought more consistently.
2. Geopolitical risk briefly eased
On the macro side, the situation around the Strait of Hormuz briefly de-escalated before Iran walked it back. During that window, oil dropped about 10%. Lower oil takes some pressure off inflation expectations, which in turn steadies broader risk markets. Crypto followed the same path as equities here. That’s nothing unusual, just correlation doing its job.
3. Regulatory direction is coming into focus
There’s also a policy angle in the background. The CLARITY Act markup is getting more attention, and while it’s not a direct price catalyst on its own, it adds to the sense that regulatory direction in the U.S. is starting to take shape.
Put together, this rally has held up better than earlier ones this year because it isn’t being driven by a single narrative. Flows are doing the heavy lifting, macro isn’t actively working against it, and policy risk looks a bit more defined. That’s a more stable mix than the short-lived spikes seen earlier in the cycle.
Bitcoin (BTC) Analysis: April 20–24, 2026
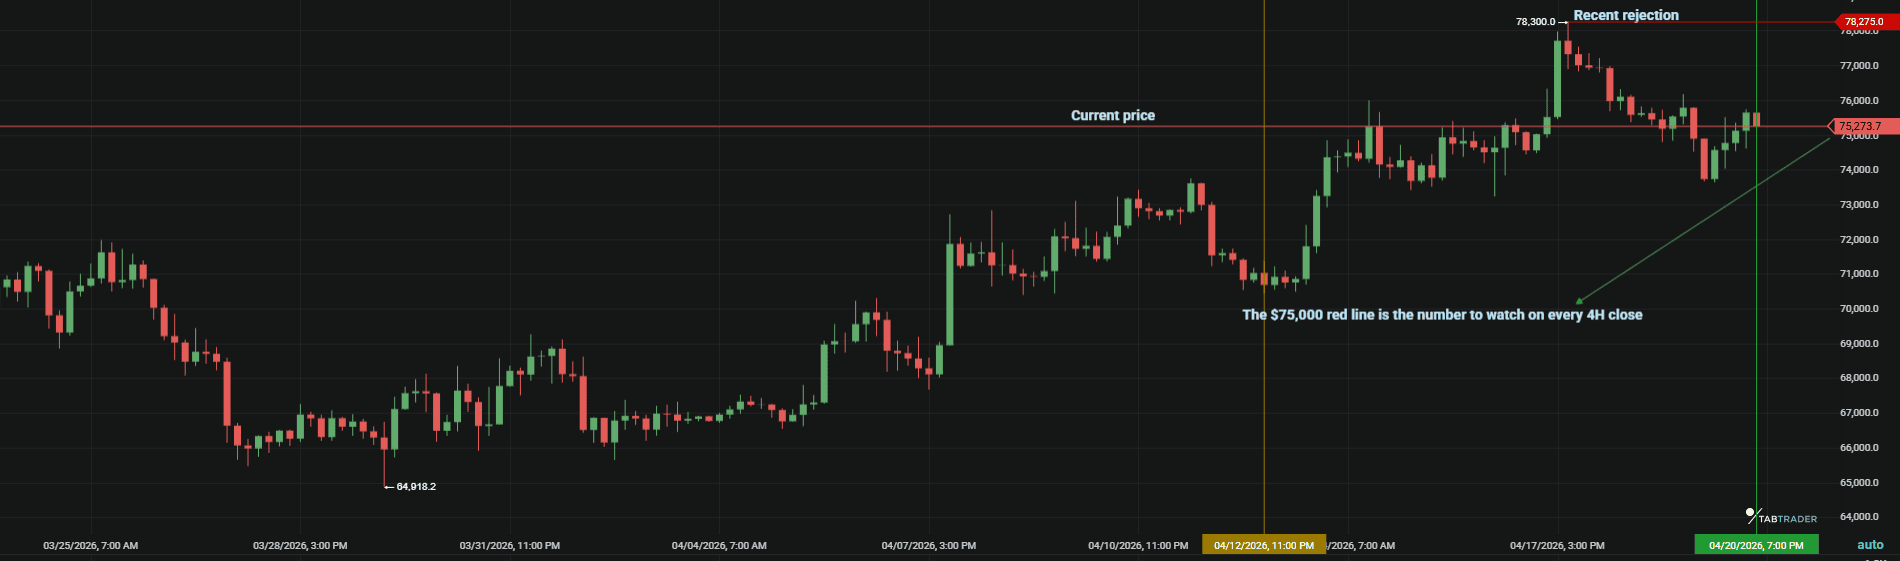
As of writing, Bitcoin has been trending higher, with buyers consistently stepping in at progressively higher levels. The short-term structure is clearly upward, and so far, that bid hasn’t shown much hesitation.
With an approximately 4% rally, the price is now testing support around $74,000. It’s held on initial checks, which keeps the current structure intact. If that level starts to break down, the tone shifts quickly and opens the door to a deeper pullback. Until then, the dips are still being absorbed.
Volume has been lining up cleanly with price moves. Expansions on pushes higher, contractions on pullbacks. That kind of participation tends to support continuation rather than signal exhaustion.
Momentum is also leaning in the same direction. RSI has been climbing without getting stretched, which usually points to steady demand rather than a crowded trade.
Over the past month, the $68,000 area has effectively acted as a floor. Each revisit has been brought without much debate, which is why it’s now seen as a key structural level rather than just another support zone.
BTC/USDT: All prices are at the time of writing and subject to change. Refresh charts on TabTrader for live data.
Key levels
The $74,000 zone is the first level to watch on the downside. It’s already been tested, and the reactions have been decent. If that starts to give way, it weakens the short-term structure pretty quickly.
On the upside, $84,000 is still the main overhead level. It lines up with the 200-period moving average and has acted as a clear ceiling before. If price gets back there, expect some friction.
BTC/USDT: All prices are at the time of writing and subject to change.
Refresh charts on TabTrader for live BTC/USDT price.
Momentum indicators
- RSI is sitting around 44, which leaves room for continuation without immediately running into overbought conditions.
- MACD has also turned up again on the daily, backing the current move rather than diverging from it.
Chart note
This week, one thing worth noting on the chart is that price has been riding the upper Bollinger Band for a bit. That usually doesn’t last without some pause. A sideways consolidation above $75K would actually be the healthier outcome here, especially if it forms something like a tight range before the next push higher.
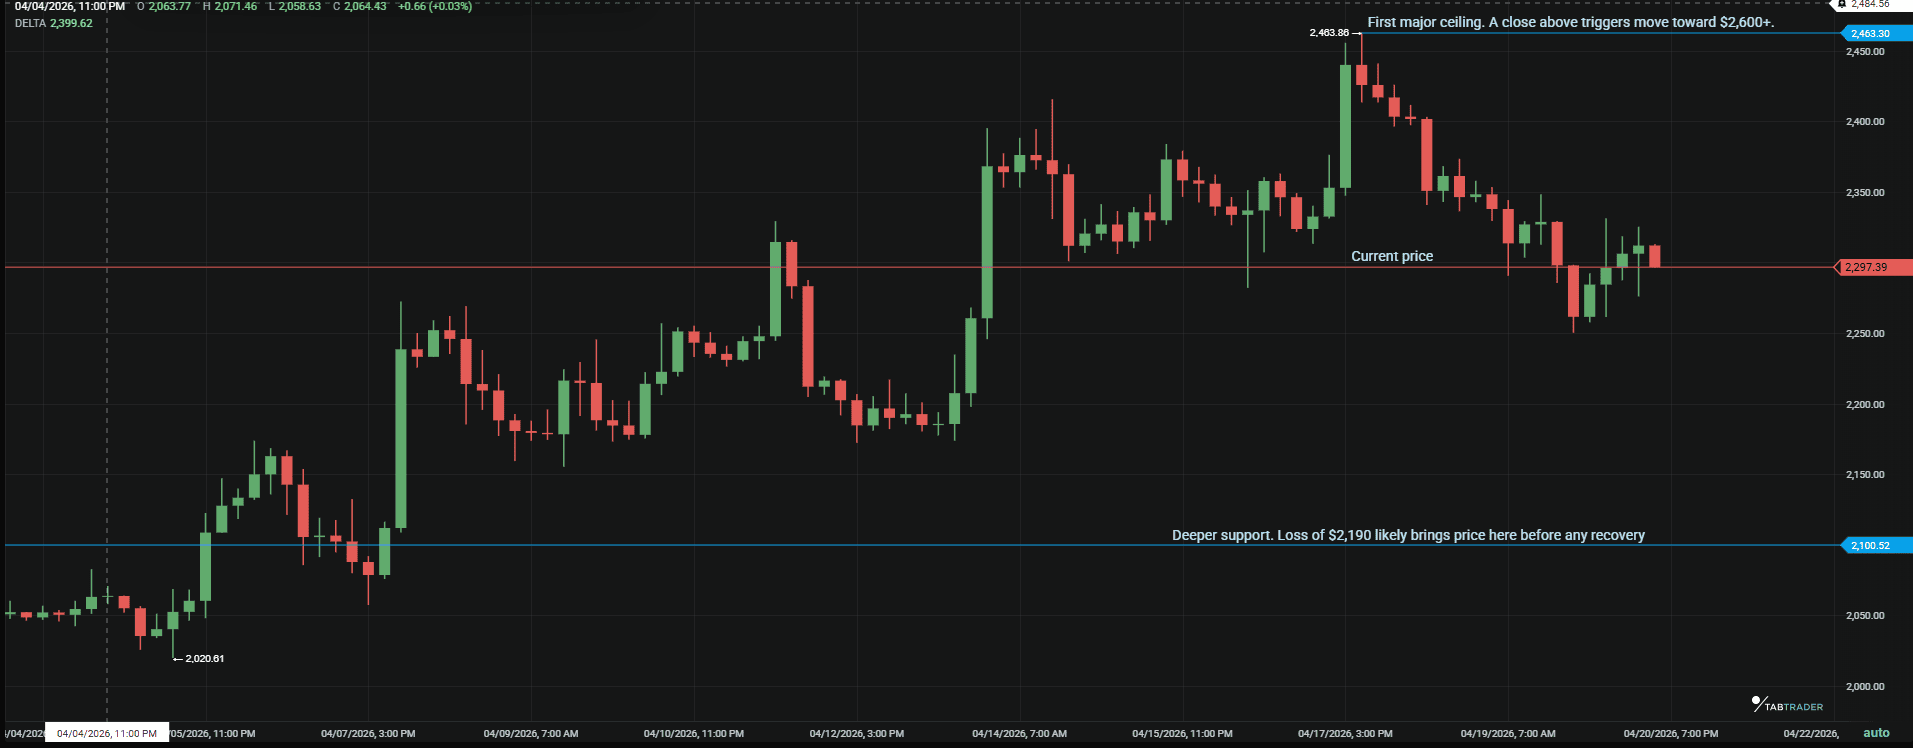
Ethereum (ETH) Price Analysis: April 20–24, 2026
ETH is sitting in the middle ground right now as it has been for several weeks. It’s not putting up the same sharp moves you see in some of the AI-linked tokens, but it’s holding up better than most of the older Layer 1s.
The ETH/BTC ratio is still low by historical standards, currently around 0.031. That said, it’s recovered about 18% from the March lows, which suggests ETH has started to regain some relative strength after lagging earlier in the cycle.
Flows are a big part of that. Liquid restaking protocols have been pulling in a significant amount of capital, and ETH sits at the center of that activity. It’s a structural tailwind, even if it doesn’t show up as an immediate price spike.
On the downside, the usual issue hasn’t gone away, meaning gas fees still climb quickly when activity picks up. The difference now is that Layer 2s like Base and Arbitrum are taking a significant share of that load, helping smooth things out during busier periods.
ETH/USDT: All prices are at the time of writing and subject to change.
Refresh charts on TabTrader for live ETH/USDT price.
Key levels
$2,500 is the main barrier. Price has stalled there before, so it’s not just another number on the chart. If it clears and holds above it, the move toward $3,000 becomes much easier. Until then, expect some hesitation around that area.
Major altcoin sector overview
| Sector | Outlook and notes |
| Layer 1 (SOL, AVAX, ADA) | Performance has been uneven. SOL is still trailing BTC on this move; ADA has drifted sideways with no clear bid. Occasional pockets of activity fade quickly. |
| DeFi (AAVE, UNI, SNX) | TVL is climbing again and translating into better price action. SNX has been a standout, though the strength is concentrated rather than broad across the sector. |
| AI / DePIN (KITE/Kite AI, RNDR, IO) | The week's clear leader by inflows and attention. Institutional interest is showing up in size, and the narrative is holding capital in place, at least for now. |
Altcoin sector summary
AI and DePIN are leading this week by a clear margin. DeFi is improving underneath, while older large-cap alts like ADA and XRP are mostly idle. They are trading, but not attracting meaningful flows. That can change, but right now there’s no obvious catalyst pushing them back into focus.
Market metrics and sentiment
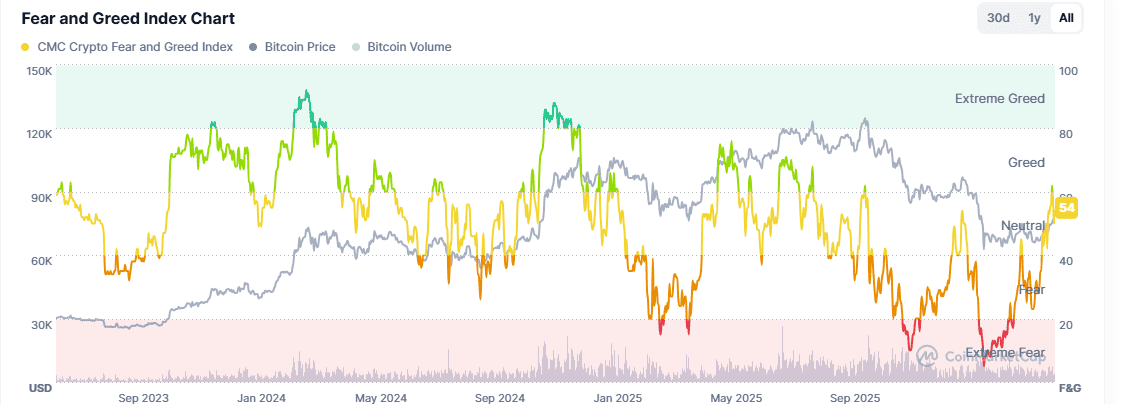
Source: CMC
- Fear/Greed Index: 54 (Neutral). Up from Extreme Fear (9) last month. We are in the phase of recovery, but traders are still cautious.
- BTC Dominance: 59%. This is still Bitcoin Season. For a true Altseason, we need to see this drop toward 50%.
Key crypto events and economic data to watch this week
- Flash PMI Data (Thursday): A reading on economic health. High means higher rates for longer rates (Bearish for crypto).
- Tech earnings (All week): If tech giants miss, the S&P 500 could pull back, dragging BTC with it.
- US-Iran Ceasefire: The ceasefire ends on April 22nd, and a new round of conflict would be bad for the market. Watch for leaks regarding a deal.
Bitcoin price scenarios for the week ahead
This week hinges on how the ceasefire situation develops by Wednesday. The outcomes are fairly straightforward, but the market reaction depends on how definitive the headlines are.
Bullish case
If there’s a formal extension or a clear framework coming out of Islamabad, risk markets likely lean into it. The war premium that built up over the past couple of weeks starts to unwind, and that tends to show up quickly in crypto.
BTC would likely push back toward $75K, with room to test $80K if momentum holds. ETH and SOL should move in step with it.
Neutral case
If there’s no real agreement but talks continue under short extensions, the market probably stalls. That kind of outcome doesn’t give traders much to position around.
In that environment, BTC chopping between roughly $73K and $76K makes sense. Volume typically fades in these stretches, and moves in either direction tend to get faded just as quickly.
Bearish case
If the ceasefire lapses without progress and tensions pick back up, especially if it impacts the Strait of Hormuz again, risk assets reprice lower.
BTC losing the $70K level would shift the structure and likely send it looking for liquidity in the mid-$60Ks. Alts would take the larger hit, as usual in risk-off conditions, with sharper drawdowns across higher-beta names.
Trader takeaway
The biggest market mover is most likely to be geopolitical tensions in the Middle East. Consequently, this week revolves around the April 22 deadline. Most of the uncertainty in the market traces back to that single event, so positioning around it matters more than usual.
Running high leverage into it doesn’t make much sense. The range of outcomes is wide, and the reaction will likely be fast in either direction. Staying relatively liquid through the 48-hour window around the ceasefire expiry gives you more flexibility once the headlines settle.
If the situation stabilizes, risk appetite should come back quickly, and crypto will follow. If it deteriorates, liquidity thins out and moves tend to overshoot on the downside. Either way, this is more about timing than conviction.
FAQs
1. Why would Bitcoin drop if war breaks out? Isn't it digital gold?
In the long term, yes. But in the short term, institutions treat Bitcoin as a high-Beta risk asset. So, when fear spikes, they sell what they can (liquid assets like BTC) to cover losses in other sectors or to move into the safety of the US Dollar.
2. Should I buy the dip if the ceasefire ends?
Historically, buying the sound of cannons works, but wait for the initial panic wick to stabilize. Look for support at the $68,000 level for Bitcoin.
3. Which sector is safest if the ceasefire is extended?
AI and DePIN tokens have shown the most relative strength. They are likely to lead the relief rally if the geopolitical clouds clear.
Spot key levels in real time, then trade smarter live on TabTrader.
Important Note: TabTrader does not provide investment, tax, or legal advice, and you are solely responsible for determining whether any financial transaction strategy or related transaction is appropriate for you based on your personal investment objectives, economic circumstances, and risk tolerance. Tab Trader may provide information that includes but is not limited to blog posts, articles, podcasts, tutorials, and videos. The information contained therein does not constitute investment advice, financial advice, trading advice, or any other sort of advice, and you should not treat any of the content as such. TabTrader does not recommend that any digital asset should be bought, earned, sold, lent out, or held by you, and will not be held responsible for the decisions you make.