Crypto Market Weekly Outlook: Why Is Bitcoin Up and What to Watch (April 28–May 1, 2026
Key takeaways
- Bitcoin is up roughly 5% on the week and, for once, it’s outperforming both major U.S. equity indices.
- On Monday, Brent crude hit $108/bbl on renewed U.S.-Iran tensions, reviving inflation fears and reducing the probability of near-term Fed rate cuts. This is now the primary macro variable for BTC this week.
- BTC remains pinned under the $76,000–$79,200 supply zone, with $80,000 as the obvious psychological ceiling everyone is watching.
- Stay ahead of the curve, the $80K resistance, the Fed meeting, and oil prices will affect pricing this week. Monitor every key level as it happens on TabTrader charts.
Why is Bitcoin up this week?
Bitcoin is up on the week and, for once, it’s outperforming both major U.S. equity indices instead of simply tagging along behind them. Price briefly pushed into the $79,000 area. That is its highest level since early February, and April is shaping up to be Bitcoin’s strongest month in nearly a year.
That move toward $80K didn’t come out of nowhere. Looking at the Bitcoin price analysis, three macro drivers are doing most of the heavy lifting right now:
1. The Iran Ceasefire helped, until It didn't
For most of March and early April, markets had to price in the possibility of a broader Middle East escalation. That matters because any threat around the Strait of Hormuz immediately feeds into oil, inflation expectations, bond yields, and then every risk asset downstream.
Once the U.S. moved to extend the Iran ceasefire, that worst-case war scenario came off the table, or at least got pushed further out.
That tailwind has now partially unwound. Brent crude hit $108/bbl this morning as ceasefire tensions resumed. Bitcoin's 2% intraday reversal from $79,480 to $77,800 was triggered almost precisely when oil began moving higher, confirming the oil-BTC relationship that has defined this entire market cycle.
Bitcoin has shown approximately 85% correlation with the Nasdaq during oil spikes in 2026. Every $10 increase in Brent is a direct headwind for risk assets.
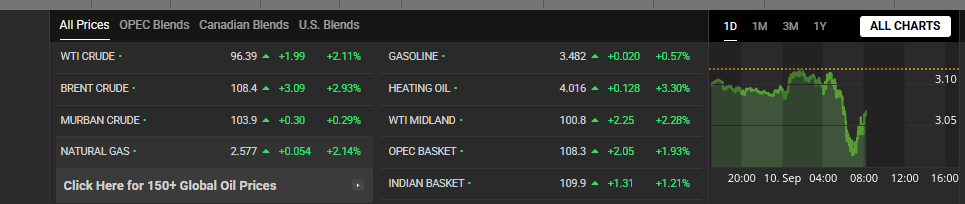
Image source: Oilprices.com
Watch level: Brent $110/bbl. If oil breaks above that level before Wednesday, expect further pressure on BTC regardless of the FOMC outcome.
2. ETF flows are still posting strong inflows
Continuing a trend seen last week, institutional money has not backed off.
U.S. spot Bitcoin ETFs continued to post strong inflows this week, extending a trend that has quietly become one of the most reliable support structures under the market. While retail traders are busy arguing over whether $80K is too expensive, large allocators are still absorbing supply on red days and green days alike.
Over the past week, Bitcoin ETFs have pulled in an additional $1.9 billion.
BlackRock remains the dominant player in that flow, but the bigger takeaway is broader than one issuer: traditional finance is once again underwriting Bitcoin’s stability.
3. Kevin Warsh’s appointment could be bullish for crypto
Kevin Warsh’s nomination to replace Jerome Powell has traders speculating that the Fed could become more market-sensitive over the next two quarters, especially if economic growth slows while inflation begins to normalize. His Senate hearing this week kept that discussion front and center.
Warsh has publicly emphasized Fed independence and has not promised immediate rate cuts, so this is not an instant bullish green light. In fact, portions of his testimony were more hawkish than expected.
Still, markets care more about forward-looking perceptions than perfect policy clarity.
And perception right now is this:
Warsh is viewed as structurally friendlier to innovation, less ideologically hostile to digital assets, and more willing than Powell to rethink how aggressively the Fed should suppress liquidity.
That alone is enough for traders to start repricing medium-term risk.
His unusually large disclosed crypto exposure only adds to the narrative that the incoming Fed regime may at least understand this sector rather than treat it like a regulatory infection.
Consequently, this week markets are trading on the possibility of a friendlier future, not on a policy shift that has already happened. If he is confirmed and follows through on his crypto promises, 100K might be back in the cards.
Bitcoin price analysis: April 28 – May 1st, 2026
Bitcoin is spending the start of the week doing what strong assets usually do after a sharp push higher: stalling just beneath resistance and forcing traders to guess whether this is healthy consolidation or the beginning of a local fade.
Right now, BTC remains pinned under the $78,000–$79,200 supply zone, with $80,000 as the obvious psychological ceiling everyone is watching. That level matters less because of chart mystique and more because it is where profit-taking, leveraged shorts, and breakout buyers tend to collide.
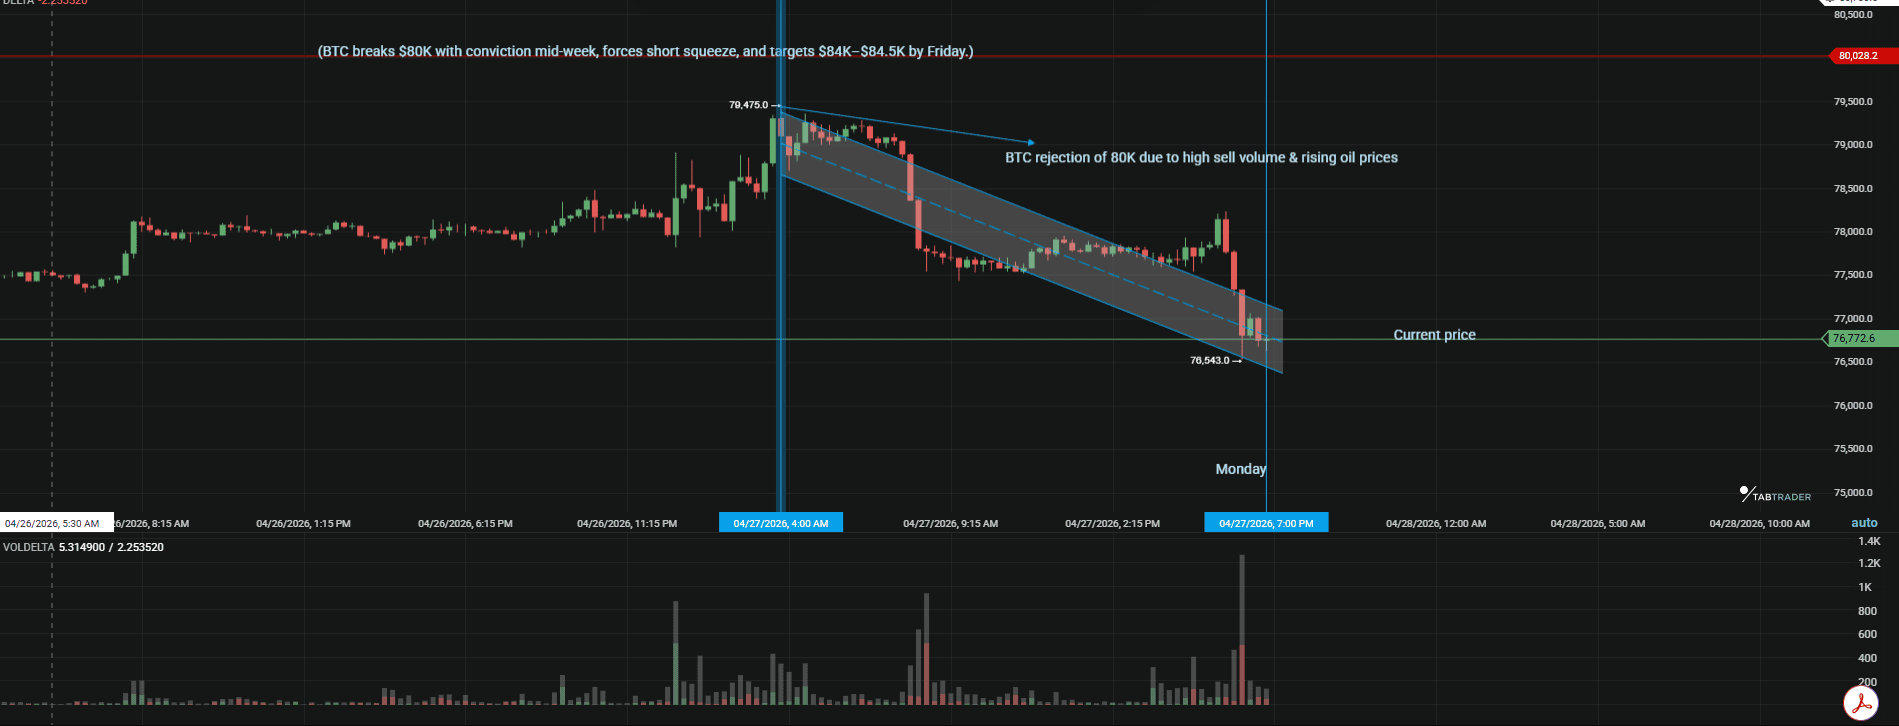
BTC/USDT: All prices are at the time of writing and subject to change.
Last week’s rally gave bulls momentum, but momentum alone does not create a breakout. Price now has to prove it can hold elevated levels without instantly slipping back into the mid-$74K.
Bitcoin is essentially attempting to convert the previous rejection zone into a base for the next leg higher. If buyers can defend this region for another couple of sessions, the market gets a much cleaner setup for an $80K retest.
Key levels
- $78,000–$79,200: Supply zone. This range has now absorbed two rejection attempts. It will take genuine volume and a macro catalyst to clear it.
- $77,000: New short-term support to watch on the daily close. If BTC cannot hold $77K, expect a move toward the 50MA.
- $75,000–$75,636: The key structural support band. 50-day MA sits at $75,636. This is where institutional ETF buyers have historically stepped in. A daily close below $75K would be a serious technical breakdown.
- $73,458: 200-day MA. Last line of defense. As long as BTC trades above this, the broader bull structure is technically intact.
Momentum indicators
- The daily RSI has backed off from overbought conditions and is now sitting in a much healthier range near 50.
- MACD is beginning to flatten, and the 4-hour structure hints at a possible bearish crossover. That usually translates into one thing: chop, fakeouts, and a possible short-term dip before the market decides on direction.
Chart note
One thing worth monitoring this week is the appearance of large visible sell walls around $80K on exchange depth books, particularly on platforms heavily used by short-term speculators.These walls are often less informative than people assume because many are spoof liquidity.
If those overhead offers begin thinning out before Bitcoin actually tags them, that usually means sellers are less committed than they appear.
And if shorts have spent days leaning into that visible resistance, the removal of those walls can trigger a very fast squeeze toward the $81K–$82K area.
Ethereum price analysis: April 27–May 1, 2026
This week, Ethereum is lagging again and still looks like a reluctant participant in this rally.
Yes, ETH has bounced with the rest of the market, but it continues to lose the relative strength battle against Bitcoin, and that is the more important signal here. The ETH/BTC pair remains pinned near multi-year depressed levels, suggesting capital still views Ethereum as a secondary exposure rather than the place to lead risk.
Ethereum’s lack of upward movement is not purely technical.
According to our analysis, it is due to a narrative issue.
Bitcoin currently has institutional ETF flows, macro liquidity speculation, and the digital reserve asset angle working in its favor. Solana and some AI-linked names have speed and fresh speculation narratives behind them.
Ethereum, by comparison, feels mature but uninspiring, and hence, investors are giving it less attention.
Key levels
- $2,425: Bullish trigger. A confirmed daily close above this level breaks the sideways structure and opens the path to $2,647.
- $2,368: Critical higher-low support. This is the most important level for ETH right now. Watch the daily close.
- $2,300–$2,301: If $2,368 fails, this is the last short-term support before a rapid move lower. Intraday price is approaching this level.
- $2,095: Bearish target. A confirmed close below $2,368 makes this the next logical destination.
Major altcoin sector overview
| Sector | Outlook and notes |
| Layer 1 (SOL, AVAX, ADA) | Bullish. SOL remains the standout here, consistently pushing stronger local recoveries than most of the large-cap field and continuing to benefit from both ecosystem growth and trader familiarity. Once a market decides which chain has momentum, it tends to keep feeding that winner longer than expected. |
| DeFi (AAVE, UNI, SNX) | Neutral. Protocols such as Aave, Uniswap, and Maker are not seeing the kind of capital flight that would suggest deep weakness. Liquidity is there, on-chain usage remains respectable, and total value locked has held together reasonably well. |
| AI / DePIN (KITE/Kite AI, RNDR, IO) | Bullish. Tokens like Axie Infinity, Virtuals Protocol, and 0G Labs continue to attract outsized momentum because they sit at the heart of the market’s favorite 2026 story: autonomous agents, AI tooling, and machine-economy infrastructure. |
Altcoin sector summary
The summary this week is that AI-integrated tokens and Solana-based assets are vastly outperforming the rest of the market. In contrast to this, High-FDV (Fully Diluted Valuation) VC coins from 2024-25 are continuously lagging.
As a result, many of these so-called VC coins are failing to catch sustained bids even when Bitcoin rallies, because participants increasingly view them as liquidity traps rather than asymmetric upside.
Market metrics and sentiment
- BTC dominance: 60%. BTC is sucking the air out of the room. A rise here usually means alts will bleed even if BTC stays flat.
- Fear/Greed index: 42 (Neutral). This neutral zone is actually healthy for a potential move higher later in the week.
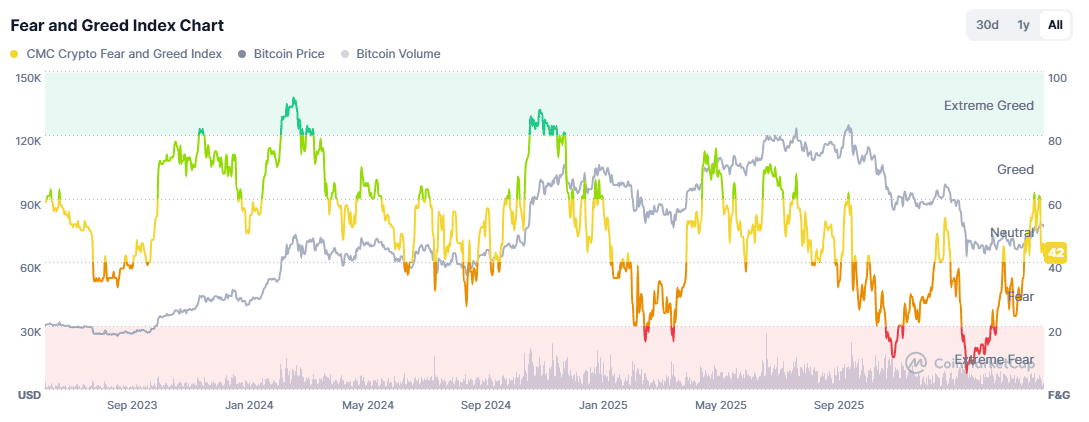
Image source: CMC.
Key crypto market events to watch this week (April 28 –May 1, 2026)
- Wednesday-FOMC interest rate decision: Wednesday is the main event by a wide margin. The Federal Reserve announces its interest rate decision at 2:00 p.m. ET, with Jerome Powell’s press conference immediately after. Markets overwhelmingly expect rates to remain unchanged in the 3.50%–3.75% range.
- Wednesday-Big tech earnings: After the closing bell, the market gets hit with earnings from four of the largest AI-sensitive companies on earth: Microsoft, Alphabet, Meta, and Amazon. This is a massive concentration of risk appetite data in one evening because U.S. equities are currently leaning heavily on AI growth expectations.
- Thursday-US Q1 GDP data: The US Bureau of Economic Analysis (BEA) is scheduled to release the advance estimate of the Q1 2026 GDP data on Thursday, April 30, 2026. This report will cover the economic performance for the first three months of the year (January, February, and March).
Possible market scenarios for the week
Bearish scenario
If Powell leans hawkish on Wednesday, emphasizes that inflation progress remains insufficient, and Thursday’s PCE data comes in hotter than consensus, markets will quickly move back toward the higher for longer interest rate framework.
That would pressure:
- equities,
- bond-sensitive growth names,
- and by extension, crypto.
Bitcoin has rallied in part because traders started pricing a less hostile macro backdrop. If that backdrop suddenly looks restrictive again, this recent optimism can unwind faster than most spot holders expect.
Neutral scenario
Oil stabilizes around $105–$107. Fed says almost exactly what traders expect. Big Tech earnings come in mixed. BTC remains trapped in a $76K–$79K compression range for the rest of the week, chopping sideways without committing to a direction. This is a frustrating but realistic outcome given the competing forces.
Bullish scenario
Brent retreats toward $100 on any diplomatic progress in Iran talks. Powell avoids sounding hawkish on oil-driven inflation. Big Tech earnings reinforce AI growth confidence.
BTC reclaims $78.5K–$79K, sets up a second $80K attempt, and breaks through to $82K–$84K by Friday. This is the cleanest runway BTC has had in weeks, but it is now conditional on the oil price, not just the crypto chart.
That would create the cleanest runway Bitcoin has had in weeks.
Bottom line
As it currently looks, the $80K trade is off the table. Wait for oil to stabilise before re-entering. Watch Brent crude alongside BTC, if oil breaks above $110, reduce exposure. Wednesday's FOMC is still the most important event, but a soft Powell tone can only partially offset an oil-driven macro headwind. Keep position sizes small. The $75K–$75,636 band is where to look for re-entry if the bearish scenario plays out.
FAQs
1. What does the Fed Chair transition from Powell to Warsh mean for crypto?
Transitions create uncertainty, and if the market expects Warsh to tighten liquidity later this year, we may see BTC struggle to maintain its premium valuation in the short term.
2. Why are AI-linked tokens outperforming established DeFi projects like AAVE or UNI?
We are in a Narrative-First market. While DeFi provides stable utility, the speculative capital (and venture hype) is currently flowing into AI agents and decentralized compute protocols.
3. Bitcoin Dominance is rising. Should I buy Altcoins now?
Generally, no. Rising BTC Dominance means money is flowing out of Altcoins and into Bitcoin as a safe haven within the crypto ecosystem.
4. How should traders handle the Fed announcement on Wednesday?
History shows that BTC often drops after the Fed announcement, even when rates stay steady. It is better to wait for the post-Fed flush to re-enter at lower support levels.
Spot key levels in real time, then trade smarter live on TabTrader.
Important Note: TabTrader does not provide investment, tax, or legal advice, and you are solely responsible for determining whether any financial transaction strategy or related transaction is appropriate for you based on your personal investment objectives, economic circumstances, and risk tolerance. Tab Trader may provide information that includes but is not limited to blog posts, articles, podcasts, tutorials, and videos. The information contained therein does not constitute investment advice, financial advice, trading advice, or any other sort of advice, and you should not treat any of the content as such. TabTrader does not recommend that any digital asset should be bought, earned, sold, lent out, or held by you, and will not be held responsible for the decisions you make.