Crypto Market Weekly Outlook: Why Is Bitcoin Up and What to Watch (May 4th-8th, 2026)
Key takeaways
- Bitcoin is up approximately 4% this week, trading above $80,000 for the first time in roughly three months. The move is being driven by four converging factors: easing Middle East geopolitical tensions, speculation around the Federal Reserve’s leadership transition, strong institutional demand via spot Bitcoin ETFs, and improving U.S. crypto regulatory clarity.
- Looking at the charts, Bitcoin if forming a sharp V-shaped recovery after last month’s washout. That rebound matters because it changes the market structure from breakdown recovery to breakout attempt. Monitor every key level as it happens on TabTrader charts.
Why is Bitcoin up this week?
Four catalysts have converged to push Bitcoin above $80,000. Here’s what’s driving the rally.
1. Easing Middle East tensions are removing the Macro headwind
For most of April, markets were pricing in the possibility that the Iran conflict would escalate into a broader energy disruption, especially amid repeated talk of a Strait of Hormuz closure. That kept oil elevated, inflation fears sticky, and the Federal Reserve rate-cut conversation mostly frozen.
Then Iran sent an updated peace proposal to mediators in Pakistan on May 1, and Washington’s response was notably less confrontational than traders had expected.
Brent crude backed off from its recent highs almost immediately.
That matters because falling oil prices remove one of the market’s main inflation headaches. As soon as energy stopped looking like an imminent policy problem, risk assets got room to breathe again. Bitcoin benefited from that shift the same way tech stocks did: less macro fear, more willingness to buy volatility.
This doesn’t mean the geopolitical risk is gone. It just means traders are no longer pricing the worst-case scenario every hour, which is a meaningful difference.
2. Powell transition is reopening the liquidity trade
Jerome Powell’s term ends this month, and markets are doing what markets usually do when a central bank leadership change is approaching. They start trading the next regime before it officially exists.
There is growing speculation that Powell’s successor could lean less aggressively on high-rate policy, or at the very least be more open to signaling cuts if inflation data cooperate through the summer.
That possibility alone is enough to change positioning.
Crypto, growth equities, and other liquidity-sensitive assets tend to move early when traders sense a softer Fed stance ahead. Nobody is waiting around for the formal appointment here. If participants think the policy tone could shift, they front-run it.
That front-running is now showing up across the board, and Bitcoin is one of the cleanest expressions of it.
3. ETF demand is supporting the rally
Macro optimism helps, but Bitcoin does not hold above major resistance without actual buyers. This time, the buyers are there.
Spot Bitcoin ETFs posted roughly $630 million in inflows on Friday, continuing what has already been one of the strongest institutional accumulation periods of 2026. April closed with Bitcoin’s best monthly performance of the year, and ETF desks have not slowed down at the start of May.
That changes the character of the move.
Without ETF demand, rallies above psychological levels like $80K often turn into brief stop-hunts followed by sharp reversals. With steady institutional bids underneath the price, sellers have a harder time forcing that kind of rejection.
In simple terms, there is real absorption happening, not just leveraged retail chasing green candles.
4. U.S. Crypto regulatory clarity is improving
Washington appears closer than it has been in years to passing a workable bill for a digital asset market structure. Senate Banking Committee Chair Tim Scott said on Friday that the Clarity Act is moving toward a bipartisan markup in May, with a Senate floor vote expected shortly after.
Markets are treating that as a serious development, not just another headline.
Institutional capital has spent years dealing with the same problem: they want crypto exposure, but they do not want to operate inside a fog of SEC lawsuits, unclear custody rules, and shifting definitions of what counts as a security.
A credible legislative framework starts removing that fog.
Nobody is buying Bitcoin solely because of one Senate bill, obviously, but regulatory clarity makes large allocators more comfortable adding exposure as macro conditions improve.
That reinforces everything else already pushing the price upward.
Bitcoin price analysis: May 4th-May 8th, 2026
BTC/USDT: All prices are at the time of writing and subject to change.
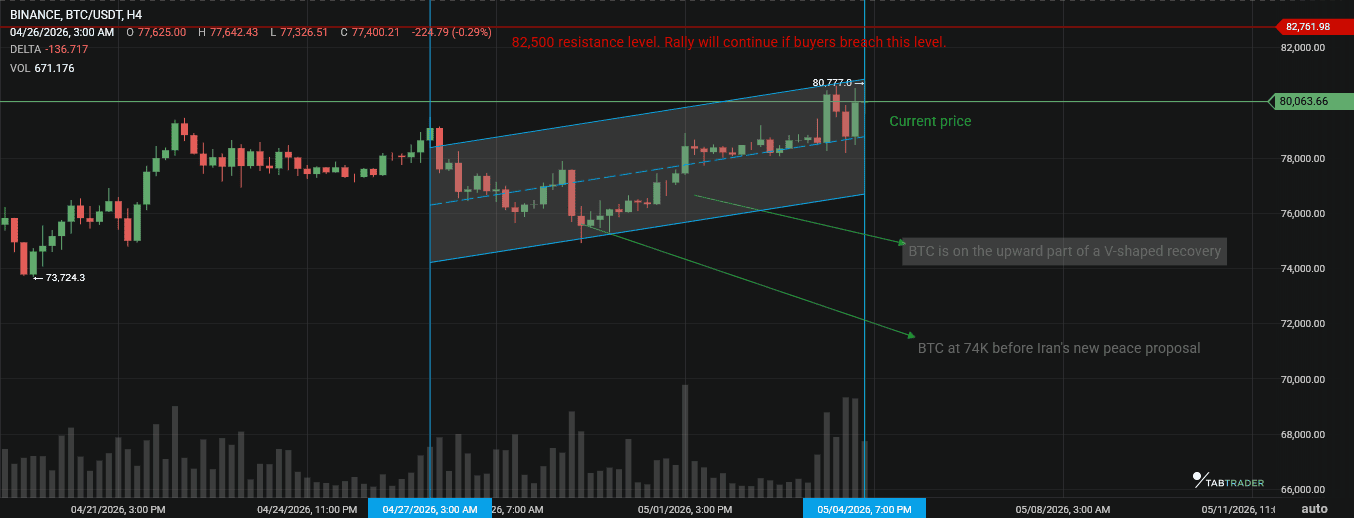
As of writing, Bitcoin is trying to complete a sharp V-shaped recovery after last month’s washout.
Price briefly collapsed into the $65,000 range during the geopolitical panic, but buyers stepped in aggressively once the broader macro picture began to calm. Since then, BTC has retraced almost the entire move and is now pressing back into the upper-$70K to low-$80K zone.
That rebound matters because it changes the market structure from breakdown recovery to breakout attempt. We are no longer looking at a coin simply bouncing off oversold conditions. Bitcoin is now testing whether it can rebuild trend continuation above one of the most-watched psychological levels in the market.
If momentum holds through the middle of the week, the immediate upside opens toward the 2026 highs near $82,500, followed by the $85,000 area. A clean break above those levels would put $90K back on the table quickly, and from there the conversation shifts carefully to whether the market can make another run at six figures later this quarter.
Key Bitcoin price levels to watch
Resistance
- $82,500: local 2026 swing high
- $85,000: major psychological barrier
Support
- $77,000: first breakout retest zone. Bitcoin needs to hold here to keep the recovery looking healthy.
- $74,000: strongest visible demand shelf on current volume structure
Bitcoin needs to stay above $77K to keep this recovery looking healthy.
A drop below that level would not automatically kill the bullish setup, but it would signal that buyers are losing short-term control and that another rotation into the mid-$70Ks is possible. If $74K gives way, then this starts looking like a failed breakout rather than a continuation.
That distinction is important this week because sentiment is improving faster than structure is fully confirming.
Momentum indicators
The daily RSI is near 55, putting Bitcoin close to overbought territory but not at an exhaustion extreme.
In strong trend expansions, RSI can stay elevated for longer than most traders expect, so this reading is better interpreted as momentum strength than an automatic sell signal.
Meanwhile, the daily MACD has completed a bullish crossover and is widening upward, showing that medium-term trend momentum has turned positive again after spending much of April compressed.
Both indicators lean toward continuation, though neither gives the market permission to ignore support levels.
Chart structure right now
On the 4-hour chart, Bitcoin has broken out of what appears to be a cup-and-handle continuation pattern that developed above the $76,000 consolidation range.
More importantly than the pattern itself, volume has been building consistently on recovery pushes instead of thinning out. That usually tells you this is not just short-covering. There are actual bids underneath the move.
The heaviest recent-volume node still sits around $74,000, making that area the strongest technical safety net below the current price. As long as BTC holds above $77K, bulls remain in control, and the short-term outlook remains upward.
Ethereum price analysis: May 4th-May 8th, 2026
Ethereum has been moving higher alongside Bitcoin, but the structure is a little different.
BTC is doing the heavy headline work right now after reclaiming $80,000, while ETH is grinding upward in a much less dramatic fashion. That usually gets ignored at first, but quiet relative strength can become important if Bitcoin stops sucking all the oxygen out of the room.
At the moment, ETH is comfortably holding above its $2,300 pivot zone, keeping the short-term recovery intact and preventing the chart from slipping back into the sluggish April range.
More importantly, the ETH/BTC pair has stopped bleeding.
That pair spent weeks under pressure as traders rotated aggressively into Bitcoin, but it is now stabilizing around a clear support floor rather than making fresh lows. In plain terms, Ethereum has stopped losing relative ground, and that often precedes capital rotating back into large-cap altcoins.
That pair spent weeks under pressure as traders rotated aggressively into Bitcoin, but it is now stabilizing around a clear support floor rather than making fresh lows. In plain terms, Ethereum has stopped losing relative ground, and that often precedes capital rotating back into large-cap altcoins.
Major altcoin sector overview
| Sector | Outlook and notes |
| Layer 1 (SOL, AVAX, ADA) | Bullish. SOL is leading the pack, outperforming BTC on the 7-day view. |
| DeFi (AAVE, UNI, SNX) | Neutral. TVL is rising, but price action is lagging the L1S. Capital is slowly returning to the space, but price performance remains noticeably behind the broader altcoin rebound. |
| AI / DePIN (KITE/Kite AI, RNDR, IO) | Bullish. High risk appetite is flowing here; RNDR is seeing massive volume. Higher-risk flows are beginning to rotate back in, with RNDR attracting the most visible speculative volume. |
Altcoin sector summary
Layer 1 tokens remain the strongest part of the altcoin board.
That has been fairly clear over the last seven days, with Solana in particular continuing to outperform Bitcoin on a relative basis while Avalanche and Cardano also hold constructive recovery structures. Traders are still favoring chains that represent core infrastructure exposure rather than niche application narratives.
When confidence is only partially restored, money usually rotates into the larger, more liquid alt names first because they offer upside without forcing participants too far out on the risk curve.
Market metrics and sentiment
Key crypto market events to watch this week ( May 4th-May 8th, 2026)
- May 5: Reserve Bank of Australia (RBA) Rate decision.
- All Week: Speculation on Iran ceasefire proposal. If Iran’s proposal is accepted, expect an immediate rally. If it is rejected, Bitcoin is likely to drop back below $78k.
- May 5: Bureau of Economic Analysis (BEA) will release the U.S. International Trade in Goods and Services report for March 2026 on Tuesday, May 5, 2026
Possible market scenarios for the week
Bullish scenario
The bullish case is straightforward. Washington responds positively enough to Iran’s Friday proposal to keep negotiations moving, and traders gain confidence that a full Strait of Hormuz disruption is becoming less likely rather than more.
If that happens, oil is likely to continue easing lower, inflation expectations are likely to soften, and global markets are likely to push further into risk-on positioning. For crypto, that would keep the current momentum alive.
Bitcoin would have a realistic shot at reclaiming the $82,500 high and running toward $85,000 if buyers remain aggressive. This is the cleanest continuation setup on the board.
Neutral scenario
If the White House acknowledges the proposal without committing to anything substantial, another round of talks gets scheduled, and both sides spend several days issuing carefully vague statements while traders try to read between the lines that may not actually contain anything.
Bitcoin would likely remain trapped in a broad $78,000 to $80,500 range, with quick directional swings whenever diplomatic rumors hit the wires. The larger bullish structure would stay intact, but upside follow-through would slow down considerably.
Bearish scenario
The bearish case is the simplest to understand: diplomacy fails, military rhetoric returns, and markets revert to pricing an extended energy shock.
That would push oil back higher, strengthen the U.S. dollar, and likely trigger another broad move out of risk assets.
Crypto generally does not respond well when macro desks are suddenly scrambling for safety and liquidity.
Under that setup, Bitcoin would be vulnerable to losing the $77,000 – $79,000 support band and sliding back toward the $74,000 high-volume demand area discussed earlier.
Bottom line
For now, Bitcoin is reacting more to diplomatic headlines than to its technical structure.
A negative overnight headline can produce a sharp liquidity sweep before stop losses have time to do their job, especially in leveraged conditions where everyone is clustered around the same obvious levels.
Because of that, this is not the week to trade oversized simply because the candles look strong.
Our advice this week is to keep position sizes a little lighter than usual. So leave enough margin for an abrupt 4% to 5% downside wick if negotiations suddenly deteriorate.
FAQs
1. How does a peace proposal in the Middle East affect my Bitcoin price?
Conflict in that region keeps oil prices high, which drives up inflation. When inflation is high, the Fed keeps interest rates high, which is bad for risk assets like Bitcoin. A peace deal lowers oil, lowers inflation, and gives the Fed a reason to be dovish (lower rates), which is fuel for a crypto bull run.
2. Why is BTC leading the rally instead of Ethereum?
In times of high geopolitical tension, investors view BTC as Digital Gold. Once the fear fully subsides and the peace deal is signed, capital usually flows from BTC into ETH and Alts for higher returns.
3. What caused this week's price volatility?
The price fluctuated sharply following reports of renewed conflict in the Middle East, with investors scrambling to assess the risks of a broader regional war.
4. What caused March Bitcoin price crash?
Bitcoin dropped into the $65,000 range in April during a period of acute geopolitical panic centred on the Iran conflict and fears of a Strait of Hormuz closure. Elevated oil prices stoked inflation concerns, which markets interpreted as reducing the likelihood of Federal Reserve rate cuts.
Spot key levels in real time, then trade smarter live on TabTrader.
Important Note: TabTrader does not provide investment, tax, or legal advice, and you are solely responsible for determining whether any financial transaction strategy or related transaction is appropriate for you based on your personal investment objectives, economic circumstances, and risk tolerance. Tab Trader may provide information that includes but is not limited to blog posts, articles, podcasts, tutorials, and videos. The information contained therein does not constitute investment advice, financial advice, trading advice, or any other sort of advice, and you should not treat any of the content as such. TabTrader does not recommend that any digital asset should be bought, earned, sold, lent out, or held by you, and will not be held responsible for the decisions you make.