Crypto Market Weekly Outlook:Bitcoin holds above $70K as traders brace for the week’s most important macro events
Key takeaways
- The weekly crypto outlook centers on Bitcoin’s recovery, facing a still-hostile macro environment. Oil’s spike above $100 before falling back to $85 signals an inflation shock. This directly affects Wednesday’s CPI and influences Fed policy, equities, and crypto positions.
- Bitcoin has reclaimed $70,000, but the broader chart structure remains fragile until a confirmed breakout above $71,500.
Market overview
As the second week of March begins, the crypto market is sitting at an uncomfortable intersection of technical pressure and macro uncertainty.
Sentiment has shifted from Extreme Fear to Fear, with BTC above $70,000. This is largely due to Middle East tensions, and in such environments, patience tends to outperform impulse trading. Markets have firmly shifted to risk-off from last year’s soft-landing narrative. Early 2026 looks markedly different.
Middle East geopolitical tensions have returned to the macro picture, and the Federal Reserve continues to signal that rates may remain elevated longer than investors had hoped.
Key macro drivers
The defining macro variable of this weekly crypto outlook is not the highly anticipated CPI, due for release on March 11th. It is crude oil , and what it does to every other number that follows.
Brent crude spiked to $119.50 per barrel at Monday's open before pulling back to trade below $90. As of this morning, prices have cooled significantly following comments from the U.S. administration suggesting the military phase of the conflict may be nearing its conclusion.
- WTI Crude: Trading near $85–$87, erasing the Monday spike but still up roughly 20–25% since the onset of hostilities.
- Brent Crude: Trading around $91, down from its triple-digit peak but maintaining a heavy war premium.
The trigger was the politics around the Strait of Hormuz, the narrow chokepoint through which roughly 20% of the world's daily oil supply passes. Shipping companies, tanker operators, and insurers have suspended transit through the strait citing security risks.
While the immediate "panic peak" of $120 oil has subsided, the market remains in a state of structural shock. The transition from a transient spike to a sustained disruption is now the primary concern for central banks.
What this means for Crypto
Higher oil prices filter directly into Consumer pricing. Energy costs cascade through transportation, manufacturing, and consumer prices , exactly the kind of inflation the Fed was making progress against. If Wednesday's CPI data reflects even a portion of the oil move, rate-cut expectations for 2026 face serious repricing.
For the crypto market, this translates into a prolonged risk-off posture from institutional allocators, tighter liquidity conditions, and increased selling pressure near major resistance levels.
Bitcoin (BTC) analysis
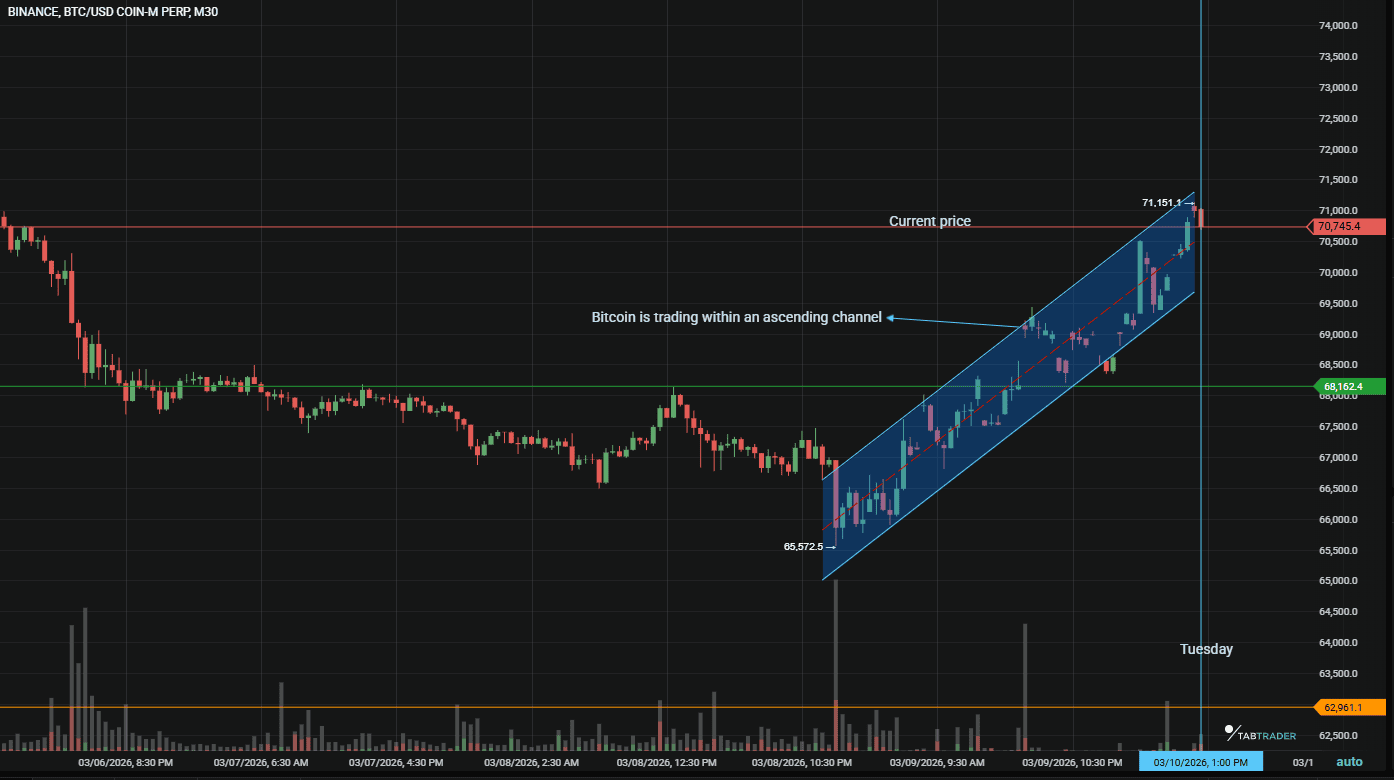
Bitcoin is trading at $70,809 at the time of writing, a meaningful psychological reclaim after spending the past week in the $65,000–$69,000 range. The move brings the TabTrader chart into sharp focus: is this a genuine breakout, or another lower high in a still-intact descending channel?
BTC/USDT
Bitcoin has been drifting within an ascending channel, with each bounce topping the previous. That pattern usually reflects growing confidence rather than aggressive shorting. At the moment, the chart doesn’t show a strong technical floor nearby, which leaves the market vulnerable to further downside if sentiment deteriorates.
One small positive is that volume balance has tilted slightly in favor of buyers in the very short term. That suggests some accumulation is happening during dips, though it hasn’t been strong enough to reverse the broader trend.
Current trend
Bitcoin is currently trading above its 20-day simple moving average, which sits around $67,100. Holding above that level would strengthen short-term momentum.
Major support
- $70,000: This is the immediate level traders are watching
- $65,000: Critical structural floor; loss triggers liquidation cascade
- $62,300: This is the next structural support if the current floor breaks
Major resistance
- $71,500: short-term pivot where sellers previously stepped in
- $74,000–$75,000: Bollinger upper band / next technical ceiling
- $79,000: level that would shift the broader structure back toward bullish territory
Indicators
- RSI: It is hovering near 33, which is close to oversold territory. Markets rarely stay stretched there for long, so a short relief bounce wouldn’t be unusual.
- MACD: rolling into bearish territory on the daily chart, indicating downside momentum is still in control.
- Bollinger Bands: Price has been hugging the lower band for much of the past week. The TabTrader chart shows the midpoint (approximately $67,876) has now been reclaimed, which is a mild positive for near-term momentum.
Bear flag watch
On higher timeframes, the price structure resembles a bear flag. This is a consolidation pattern that typically resolves in the direction of the preceding move, which in this case was down.
To break that structure, Bitcoin would need a daily close above $71,500. That would force a re-evaluation of the bearish setup.
If Bitcoin fades from the current $70,809 level and loses $65,000, the TabTrader chart shows relatively little structural support between there and $56,000. That gap matters — markets move quickly through liquidity vacuums, and a break of $65K would likely accelerate rather than slow.
Ethereum (ETH) snapshot
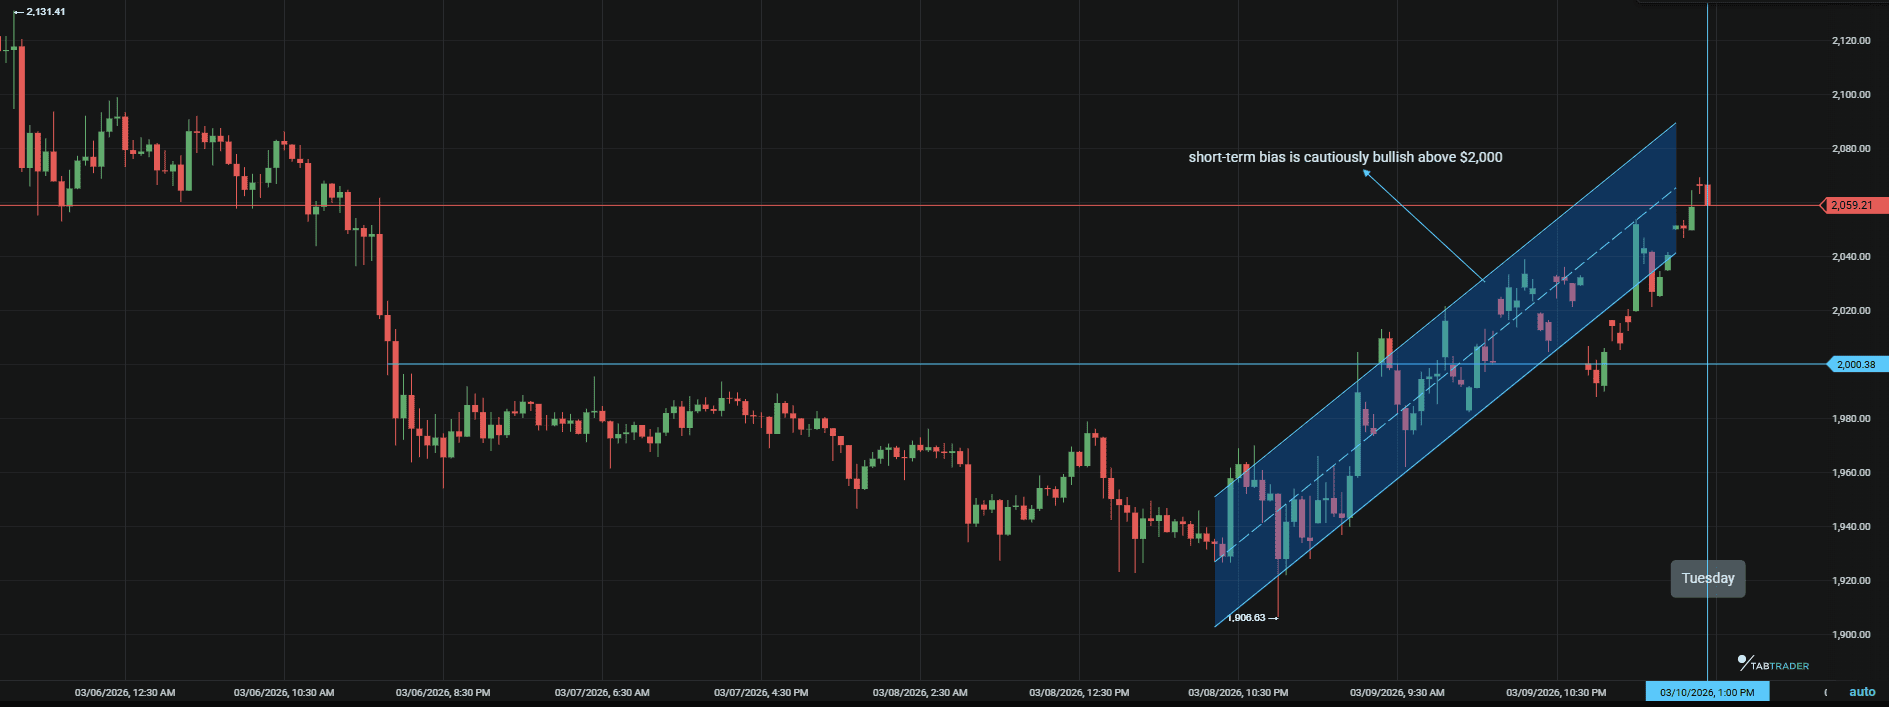
Ethereum has spent most of this cycle playing defense. Against the dollar, it has underperformed Bitcoin, and the ETH/BTC ratio has been grinding lower for months. Even so, the selling pressure is starting to lose some intensity. The chart is beginning to hint at cautious optimism.
ETH/USDT
Part of the renewed attention comes from the recent “Prague” network upgrade, which rolled out without major issues, concrete institutional buy and a market-wide relief rally. That doesn’t immediately change price direction, but it has brought some relief back.
Several are quietly circling the $2,000 region as a long-term accumulation area. It’s just cautious nibbling by brave traders while sentiment remains weak.
Key data
- $1,800 – $1,950: This range has effectively become Ethereum’s structural floor. If it holds, the market can continue building a base.
- $2,730: Significant resistance overhead where previous rallies stalled.
Major altcoin sector overview
Layer 1 tokens
Solana continues to stand out, particularly in trading volume. The market is closely watching the $82 level, which has held so far.
DeFi
Total value locked has stalled. A noticeable share of capital has shifted toward stablecoin yields, which are sitting above 5%.
Gaming / AI tokens
These tokens behave like high-beta trades, and they tend to suffer first when markets move into risk-off mode. Consequently, price structures here are weaker than in Layer 1 majors, and liquidity thins out quickly during sell-offs.
Altcoin sector summary
Among the major altcoin categories, Layer 1 networks are holding up better than the rest of the field. The relative strength largely traces back to Solana, which continues to attract heavy trading activity and ongoing speculation around potential institutional products tied to the ecosystem.
Other sectors look quieter. Gaming tokens remain under pressure, and most of the AI-related names have cooled off as speculative capital moves to the sidelines. With the next FOMC decision approaching, traders appear reluctant to take large directional bets in smaller-cap assets. For now, liquidity is concentrating in the larger networks while the rest of the market waits for clearer macro signals.
Key events to watch this week
- Tuesday, March 10: Markets digest the oil shock and position ahead of CPI. Expect volatile intraday swings as traders price scenarios.
- Wednesday, March 11: U.S. CPI Report: The week's primary volatility trigger. Wage inflation ticked higher in the prior report; another hot print combined with surging energy costs could materially delay rate-cut timelines. This is the number.
- Thursday, March 12: Jobless Claims: Typically a second-tier release, but labor data is receiving closer scrutiny as policymakers assess whether the economy is absorbing the energy shock or beginning to slow.
- March 17–18: FOMC Meeting: Rate hold is near-certain. The operative question is tone, specifically whether the committee signals any concern about the oil-driven inflation resurgence, and how that shapes the rate path narrative going forward.
Possible scenarios for the coming week
Bearish case
If CPI prints hotter than expected (above roughly 2.6%), markets may push rate-cut expectations even further out. In that scenario, Bitcoin losing $65,000 would likely trigger liquidation pressure across leveraged positions, opening the door toward the $56,000–$60,000 region.
Neutral case
A mixed or inconclusive CPI print could leave markets stuck in consolidation. Under that outcome, Bitcoin likely rotates between $66,000 and $69,000 while traders wait for clearer guidance from next week’s Federal Reserve meeting.
Bullish case
A softer inflation reading (around 2.3% or lower) would likely shift sentiment quickly. A Bitcoin reclaim of $71,500 would weaken the current bearish structure and could set up a move toward the $79,000 resistance zone later in the week.
Bottom line
Two forces are shaping the market right now: inflation expectations and geopolitics.
Liquidity has thinned out, and the market is waiting for a macro signal strong enough to shift positioning. The CPI report is the most likely candidate. If inflation shows convincing signs of cooling, a sharp relief rally would not be unusual, given how defensive positioning has become. If the data runs hot again, fear levels could deepen and extend the current downtrend.
The CPI print and crude oil price will define the rest of the week. Don’t try to predict the market. React to what actually happens. Set up your alerts on TabTrader and let the price come to you.

Set alerts on TabTrader.
Important Note: TabTrader does not provide investment, tax, or legal advice, and you are solely responsible for determining whether any financial transaction strategy or related transaction is appropriate for you based on your personal investment objectives, economic circumstances, and risk tolerance. Tab Trader may provide information that includes but is not limited to blog posts, articles, podcasts, tutorials, and videos. The information contained therein does not constitute investment advice, financial advice, trading advice, or any other sort of advice, and you should not treat any of the content as such. TabTrader does not recommend that any digital asset should be bought, earned, sold, lent out, or held by you, and will not be held responsible for the decisions you make.