Crypto Market Weekly Outlook: Why Is Bitcoin Dropping and What to Watch (March 30–April 3, 2026)
Key takeaways
- Bitcoin has slipped to a two-week low and is hovering in the mid-$66K range.
- Altcoins took the bigger hit: ETH, XRP, Solana, and AVAX all sold off roughly 5% on the same move.
- Relative to Bitcoin, the ETH/BTC pair is still near multi-year lows, suggesting BTC is absorbing most of the demand and ETH is left behind.
- Macro pressure and liquidity tightening are driving a risk-off environment.
Why is Bitcoin dropping this week?
Over the past week, Bitcoin rose gradually, then suddenly lost ground. The move down looks more like a reaction to macro and structural factors than any single headline.
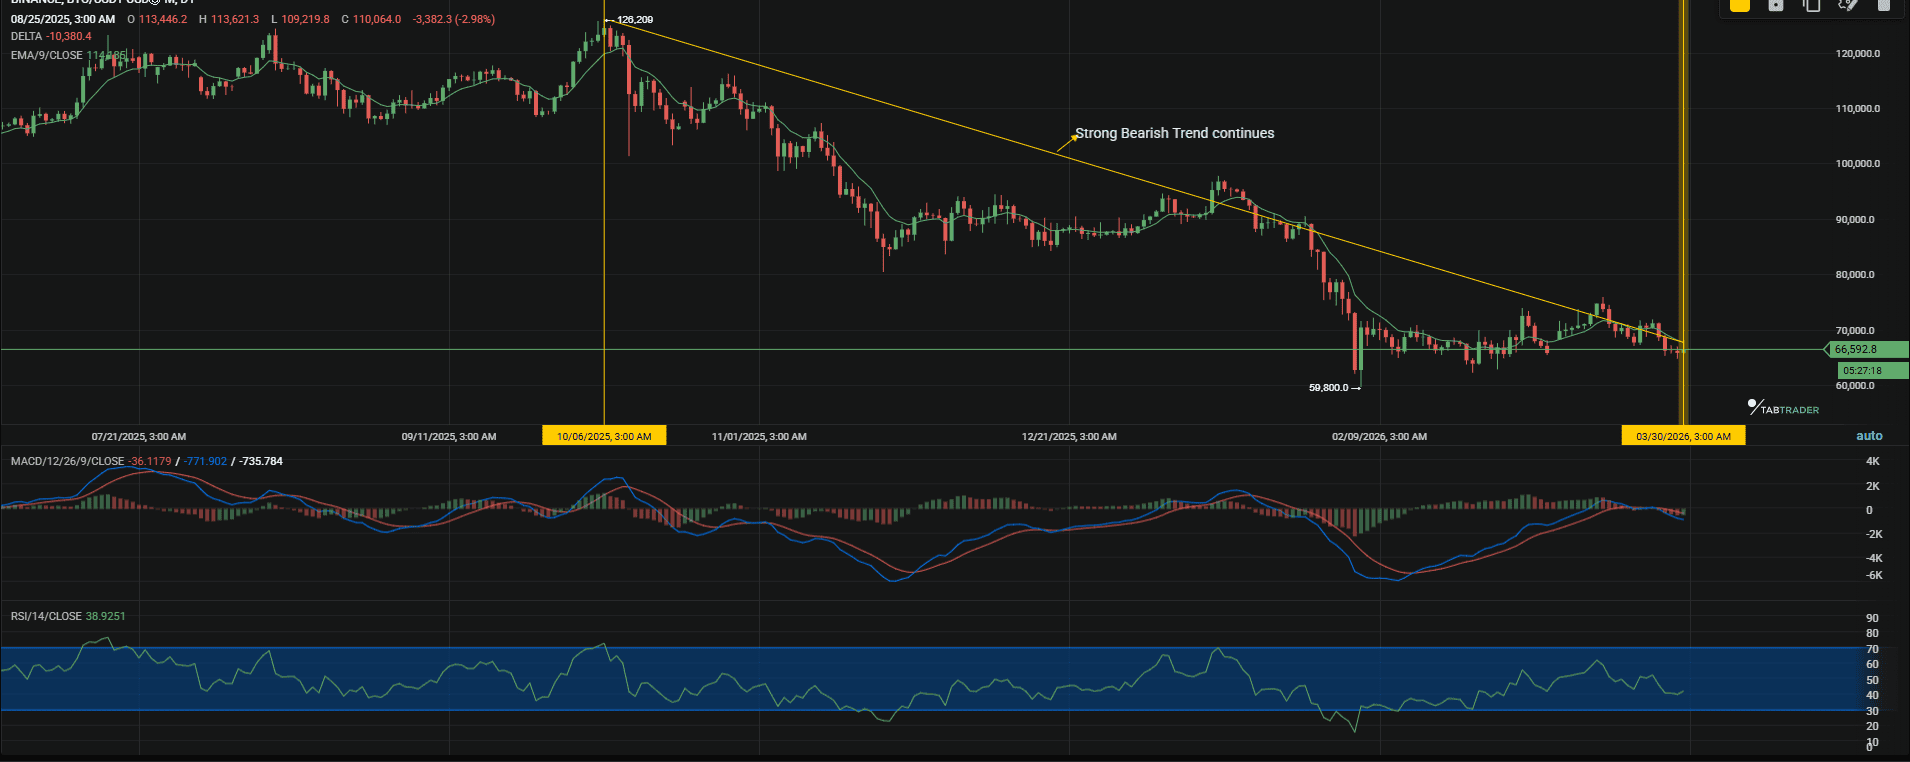
After topping out around $126,000 in October 2025, BTC has been in a steady drawdown. The move down hasn’t been smooth, but one level keeps standing out. Around $66,000, buyers keep stepping in. That zone has been tested multiple times now, and each bounce has been weaker than the last, which isn’t a great sign. As of writing, Bitcoin is back there again.
The March 27 options expiry pushed the price down to about $65,700 at the lows. That kind of expiry tends to act like a magnet in the short term, especially when positioning is crowded. Once it cleared, there wasn’t much support underneath.
At the same time, macro conditions turned against risk assets. Escalating tensions in the Middle East have kept oil elevated, and that feeds directly into inflation expectations. Higher energy prices complicate the Fed’s path forward. Rate cuts get pushed further out, liquidity stays tight, and assets like crypto usually take the hit first.
After bottoming near $60,000 in early February, BTC recovered to roughly $74,500 by mid-March. That move had some real backing, about $767 million in ETF inflows over five straight days, the first sustained positive streak this year. It wasn’t just a bounce; there was actual demand behind it.
Despite these positive signals, that momentum didn’t last.
In the latest move over the weekend, the market dropped quickly by about 3–4% in a matter of hours. This wiped out a chunk of market cap across the board. All in all, Bitcoin slipped to a two-week low and is hovering in the mid-$66K range. Altcoins took it worse, as usual. ETH, XRP, Solana, and AVAX all sold off harder, roughly 5% on the same move.
With all these losses, the market is firmly in risk-off mode.
Key macro drivers
Geopolitics might be dominating headlines, but the real pressure is coming through macro channels.
- Oil price: Elevated oil prices are feeding into inflation, which keeps central banks cautious. That, in turn, limits liquidity. Crypto doesn’t do well in that kind of environment.
- Broad tactical derisking: This sell-off looks more like broad de-risking than anything crypto-specific. Investors are cutting exposure across the board, and digital assets are getting caught in that rotation.
- Liquidations hit market hard: Roughly $451 million in long positions were liquidated over a 24-hour period, prompting further selling as positions were wiped out.
- ETFs Outflows: Demand has also cooled. ETF flows, which helped drive the March recovery, have started to reverse.
- Tech stocks correlation: There’s also the equity angle. Bitcoin has been trading more like a high-beta tech stock than an uncorrelated asset. As tech has pulled back, BTC has followed.
- U.S. bond market jitters: One of the bigger pressure points is the bond market. The U.S. 10-year Treasury yield is pushing toward 4.5%, its highest level since July. Higher yields raise the baseline return on safe assets, making risk assets less compelling by comparison.
- Options expiry: Around $15.5 billion in Bitcoin and Ethereum contracts are set to expire, with Bitcoin making up the bulk.
Bitcoin price analysis and technical outlook
Bitcoin is still stuck in a narrow range, hovering around the mid-$66K area. The small 24-hour gain doesn’t change much. On the surface, it looks stable. Underneath, positioning tells a different story.
Liquidation data shows a noticeable imbalance building up. That usually means the next move won’t come from organic buying or selling pressure, but from forced flows. Movement will come from positions getting squeezed out.
Price action reflects that hesitation. BTC keeps getting rejected in the $70K–$72K range, and each attempt to push higher runs out of steam quickly. On the 4-hour chart, the structure leans slightly bearish. Nothing aggressive, just a slow drift lower.
Bollinger Bands back that up. Price is sitting below the mid-band, which typically signals that buyers aren’t in control right now.
BTC/USDT
Key levels to watch
- Support: Around $68K. If that level gives way cleanly, the next meaningful liquidity pocket sits closer to the high-$50Ks. Moves can get fast once that kind of level breaks.
- Resistance: $74K, then $79K. BTC hasn’t come close to reclaiming either with conviction.
Indicators
- RSI is sitting in the high 40s. It is weak, but there’s still room for price to drift lower without triggering oversold conditions.
- The MACD isn’t showing much buyer commitment either. Momentum is flat, and rallies lack follow-through.
Ethereum price analysis
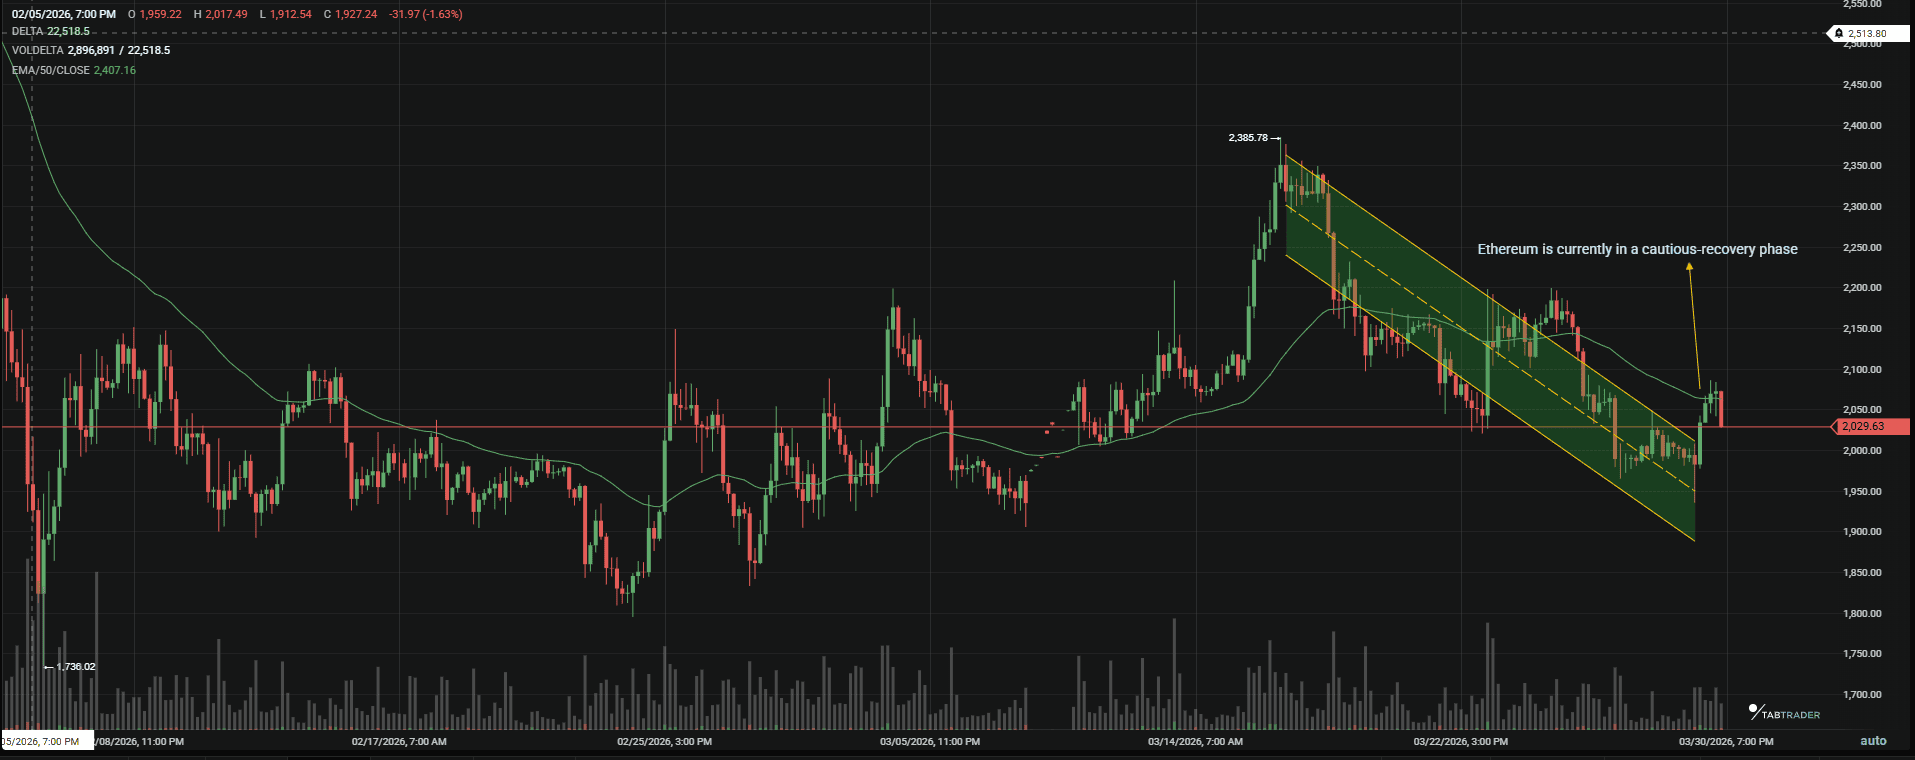
Ethereum saw a decent push higher early on, but it ran into a wall around $2,370 and gave back much of that move.
Since then, the price has settled into a range, hovering around $2,000. The broader structure hasn’t really changed. The range between roughly $1,900 and $2,200 has held so far, but it feels more like a pause than a base.
ETH/USDT
What’s missing is follow-through. Each bounce stalls before breaking into higher highs, which keeps the broader trend in question.
Relative to Bitcoin, ETH isn’t doing itself any favors. The ETH/BTC pair is still sitting near multi-year lows, which tells you where capital is flowing. When the market gets defensive, BTC tends to absorb most of the demand, and ETH gets left behind.
Key levels
- Support: $2,000. This is a psychological line. A clean break below it would likely shift sentiment quickly and open the door to a deeper move down.
- Resistance: Around $2,450. That’s where the last rally failed, and it’s likely to act as a ceiling again unless momentum changes.
Major altcoin sector overview
Layer 1 (SOL, AVAX, ADA)
Most L1s are just moving with the broader market, but Solana is holding up better than the rest. It’s been trading around the low $90s and showing some relative strength, mostly driven by ongoing ecosystem activity.
DeFi (AAVE, UNI, MKR)
Prices haven’t reflected it, but usage is picking up. Total value locked is pushing toward the $100B mark again, which tells a different story than the charts. Capital is still being deployed, just without the price reaction you’d expect.
Gaming (AXS, SAND, MANA)
These have taken the hit you’d expect in a risk-off market. High-beta names tend to get sold first, and there’s not much appetite for speculative sectors right now. The charts reflect steady bleed, no real support stepping in.
Altcoin sector summary
Solana is the only major L1 showing any real independence from the broader market, and even that has limits. DeFi looks healthier than the price suggests, with usage holding up despite the drawdown. Gaming, on the other hand, is still being avoided.
Market metrics and sentiment
- Fear/Greed Index: 27(Fear). We’ve been here for weeks. Historically, this is an accumulation zone for long-term holders, but a pain trade for levered swing traders.
- Stablecoin flows: Total Stablecoin Market Cap is at an all-time high of $317B. This means there is massive dry powder sitting on the sidelines.
Key crypto events and economic data to watch this week
- Tue, April 1st: US ISM Manufacturing PMI (Inflation indicator).
- Wed, April 2nd: ADP Private Payrolls.
- Fri, April 3rd : US Non-Farm Payrolls (NFP).
Bitcoin price scenarios for the week ahead
Bearish scenario
If Bitcoin loses the ~$69K area, the downside could accelerate quickly. That kind of macro signal tends to push yields higher and further tighten conditions. In that environment, support levels don’t usually hold for long. The next meaningful zone sits in the mid-$50Ks, roughly $54K–$58K, where the last real base formed.
Neutral scenario
Price continues to chop between roughly $69K and $73K. That would give indicators like RSI time to cool off without forcing a deeper correction. This is usually where altcoins try to stabilize and carve out local bottoms.
Bullish scenario
A softer jobs report would ease some of the pressure from rates and could bring buyers back in. If BTC can push through $75K and hold it, that’s a shift in tone, not just a breakout. From there, the next area to watch sits around the low-$80Ks.
For a broader perspective on how similar setups have played out, refer to our previous Crypto Chart of the Week analysis, where we break down recurring market patterns and trader behavior.
Bottom line: Traders are waiting for better conditions
Currently, the market is in a holding pattern. There's plenty of capital sitting on the sidelines, the $317B stablecoin market cap is evidence of that, but it hasn't been deployed yet. That usually means interest is there, just waiting for better conditions.
The problem is that the macro hasn't eased up. Oil prices and upcoming jobs data are still driving the narrative, keeping risk appetite in check. Until that pressure fades, it's hard to argue the bottom is fully in.
If those levels keep holding, the broader uptrend stays intact, even if it's messy in the short term. This is where patience matters more than positioning.
FAQs.
Why are altcoins falling more than Bitcoin?
During uncertain market conditions, investors rotate capital from altcoins into Bitcoin, which is seen as a relatively safer asset within crypto. This causes altcoins to drop more sharply.
What does a strong NFP report mean for crypto?
If the NFP report shows strong employment, it suggests the economy is too strong, giving the Fed an excuse to keep interest rates higher for longer. Higher rates mean tighter liquidity, which weighs on risk assets, including Bitcoin and altcoins.
Is this a good time to buy Bitcoin?
Periods of extreme fear have historically been accumulation zones for long-term investors. However, short-term traders should remain cautious due to ongoing volatility.
Important Note: TabTrader does not provide investment, tax, or legal advice, and you are solely responsible for determining whether any financial transaction strategy or related transaction is appropriate for you based on your personal investment objectives, economic circumstances, and risk tolerance. Tab Trader may provide information that includes but is not limited to blog posts, articles, podcasts, tutorials, and videos. The information contained therein does not constitute investment advice, financial advice, trading advice, or any other sort of advice, and you should not treat any of the content as such. TabTrader does not recommend that any digital asset should be bought, earned, sold, lent out, or held by you, and will not be held responsible for the decisions you make.